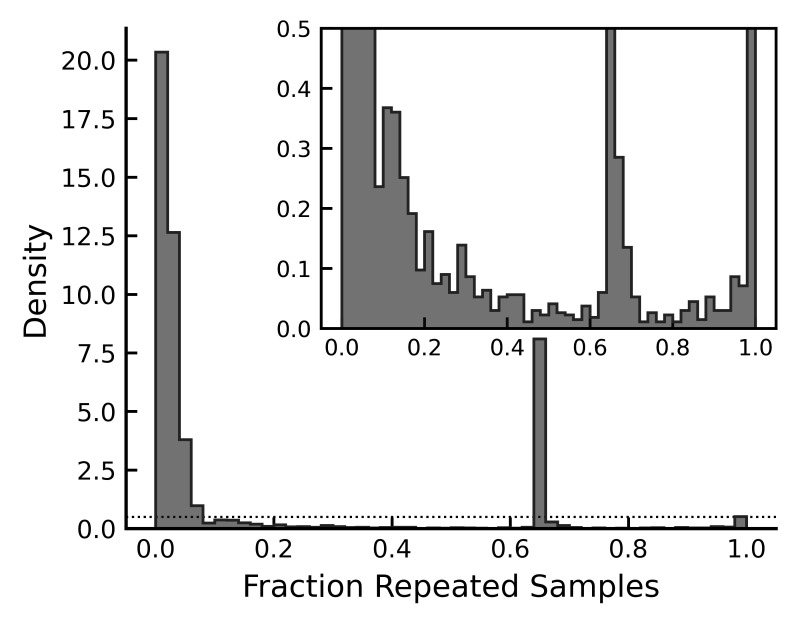
Figure 2.
Frequency density histograms of the fraction of repeated samples in each trial (an indirect measure of invalid samples). The inset in the top right corner displays the same histogram with the y axis zoomed to a maximum value of 0.5 (dotted line) to better visualize small frequency densities beyond the three major clusters. Data shown includes all trials regardless of whether the left, right, or combined gaze representation had repeated samples.

