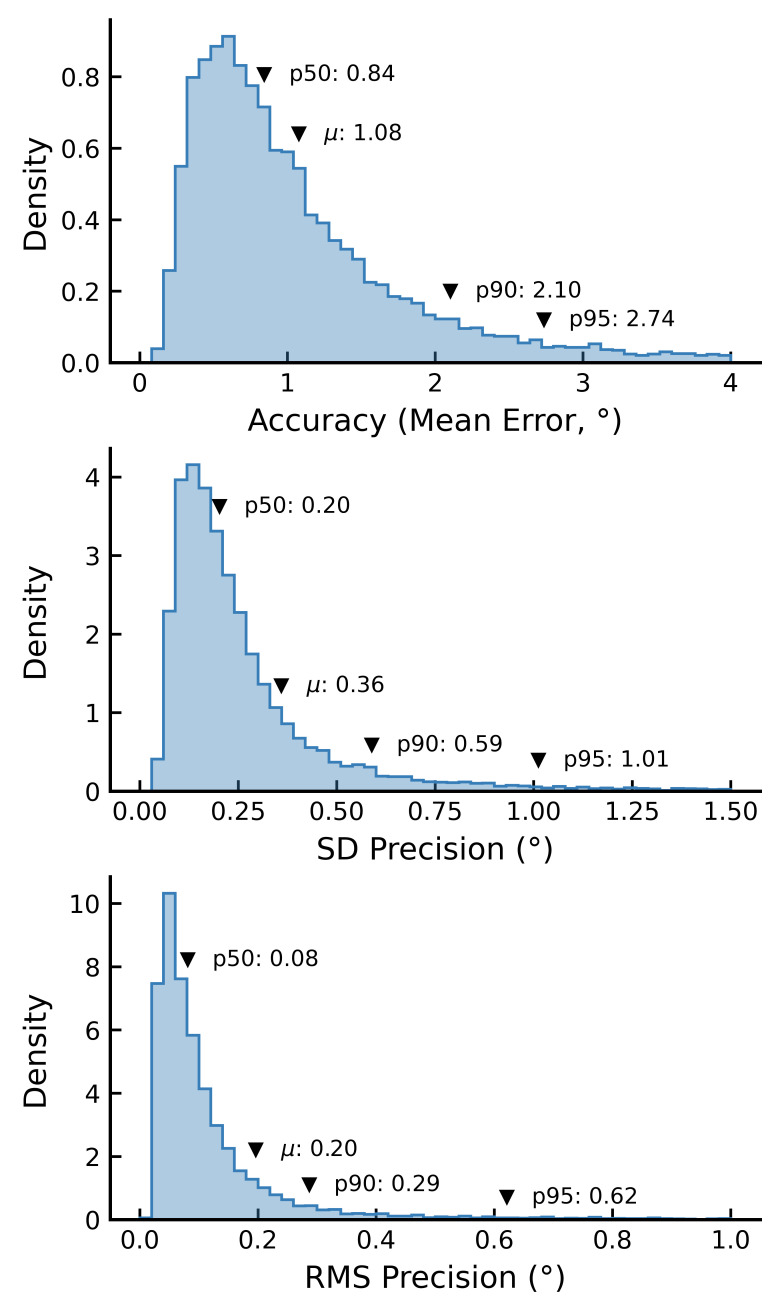
Figure 3.
Frequency density histograms of accuracy and precision metrics across all validation trials (combined gaze). Top: Accuracy (average absolute error relative to target), Middle, Bottom: Precision (standard deviation and inter-sample root mean square error of gaze angles). Histograms are based on fixations to all presented target positions. Means and percentiles for each measure are annotated to allow direct comparison with device specifications. Data computed before outlier correction. Note: Plots are truncated at a specific x value (4°, 1.5°, and 1°, respectively) to better visualize the overall distributions and percentiles.

