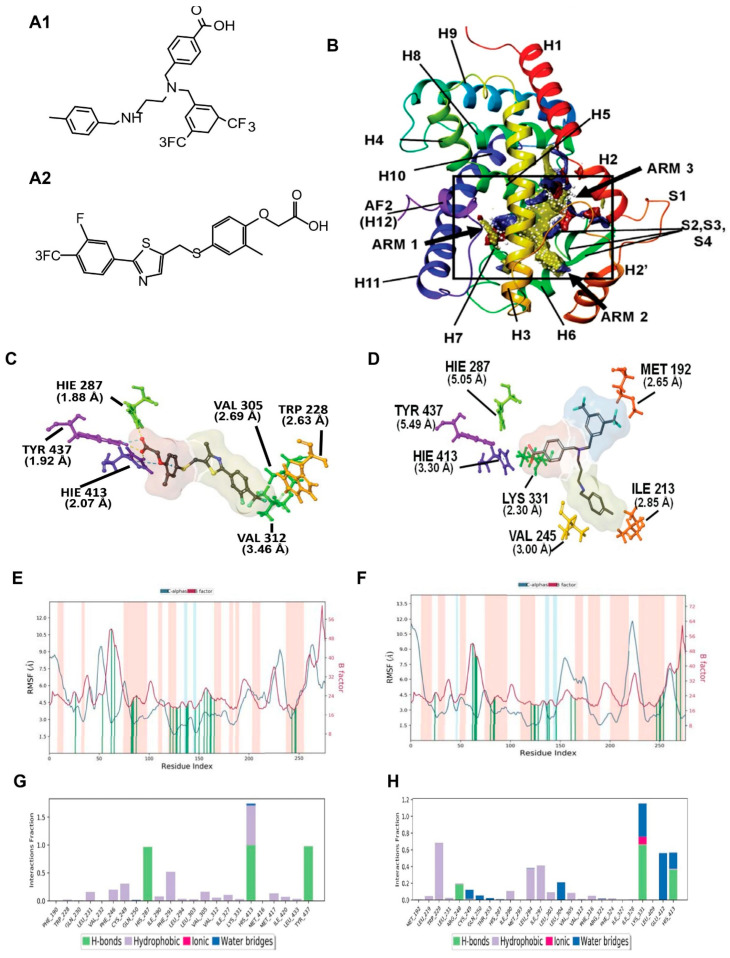
Figure 1.
Molecular modeling for PPARδ showing comparison between GW0742 (PPARδ agonist) and AU9. (A) Chemical structure of AU9 (A1) and GW0742 (A2). (B) Site map analysis of PPARδ ligand binding domain (LBD) PDB: 3TKM. Hydrophobic surface map (yellow), hydrogen-bond donor surface map (blue), and hydrogen-bond acceptor surface map (red). α-helices and β-sheets labeled H1–H12 and S1–S4, respectively, from N-terminus to C-terminus. Y-shaped ligand binding pocket where arm 1 contains the AF2 domain, arm 2 is the entrance site, and arm 3 is a secondary ligand binding pocket: (C) GW0742 lowest energy conformation and amino acid binding interactions with distances (angstroms). GW0742 forms a hydrogen bond network to the AF2 domain, indicating a full agonist. (D) AU9 lowest energy conformation and amino acid binding interactions with distances. AU9 avoids a key interaction at TYR 437 (H12/AF2) yet maintains a critical contact at HIS 413. (E,F) Molecular dynamics root-mean-square fluctuation (RMSF) plots. The blue graph represents the ligand-induced α-carbon fluctuation overlaid with the red graph experimental b-factor. α-helices and β-sheets are shaded red and blue, respectively, from N-terminus to C-terminus. Vertical green bars indicate ligand-residue contacts. (E) GW0742 displays ligand-induced stabilization of the AF2 domain (residue index > 250) represented by a decrease in the RMSF as compared to the b-factor plot, approximately 5-fold. (F) AU9 displays ligand-induced stabilization of the AF2 domain while avoiding contact to TYR 437, approximately 1.5-fold. (G,H) Protein interaction diagram categorized by the fraction and type of interactions maintained throughout the simulation. (G) GW0742 maintains hydrogen bonds to the AF2 residue TYR 437 with supporting hydrogen bonds to HIS 413 and HIS 287 as the major contribution of ligand–protein contacts. (H) AU9 maintains a mixture of hydrogen bonds/water bridges/ionic interactions at LYS 331, GLU 412, and HIS 413, which predominate through the course of simulation. Analysis of the molecular dynamic simulation are reported in a protein–ligand contacts plot (E–H), which calculates the nature and fraction of bonds formed with protein residues throughout the simulation. Stacked bar charts are normalized over the course of trajectory, and values greater than 1 indicate that the protein residue is making multiple ligand contacts of different subtypes. The contributions a ligand may have on protein stability were calculated using the protein root mean square fluctuation (RMSF) plot. The protein RMSF plot ((E,F), Figure 2E,F) characterizes the local changes along the protein chain, relative to the ligand, throughout the course of simulation and is listed on the left-hand y-axis. The y-axis is the experimental x-ray B-factor. B-factors are experimentally determined from data submitted with the PDB x-ray crystal structure and indicate the relative vibrational motion with different atoms located in the structure [34]. Ligand induced changes in the protein RMSF should approximate the experimental B-factor, otherwise significant structural changes are occurring. Green vertical lines represent ligand–protein contacts. Shaded areas represent protein secondary structures, where red are alpha helices and blue are beta-strands ((G,H) and Figure 2G,H).

