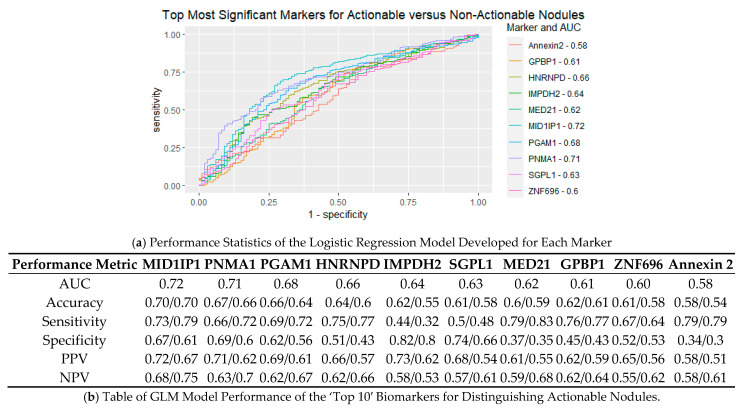
Figure 4.
Assessment of Logistic Regression Models for Top Performing Biomarkers. The performance characteristics of general logistic regression models developed for each of the top 10 most significant biomarkers are provided. Panel (a) illustrates a ROC curve for each of the biomarkers based on a training cohort. Area under the curve (AUC) values can be seen next to the marker name in the legend. Panel (b) details the performance metrics for each of the general logistic models are shown for the training set used to create an optimal cut-off value and an independent test set.

