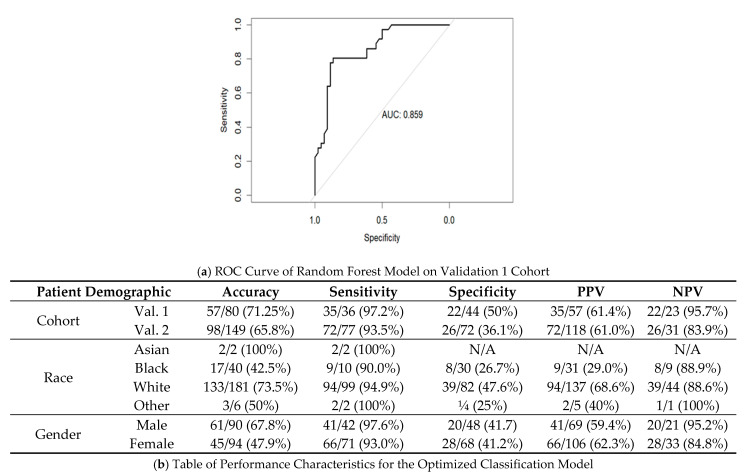
Figure 5.
Assessment of Sensitivity Optimized Classification Model. (a) The ROC developed from predicted risks determined by the random forest model in the Validation 1 cohort. From these predicted risk values, thresholds (or ‘cut-offs’) were chosen, which allowed for the highest specificity with a sensitivity of 95%. (b) The model performance when utilizing the optimized cut-off value in Validation 1 and Validation 2 cohorts, with further resolution by race and gender.

