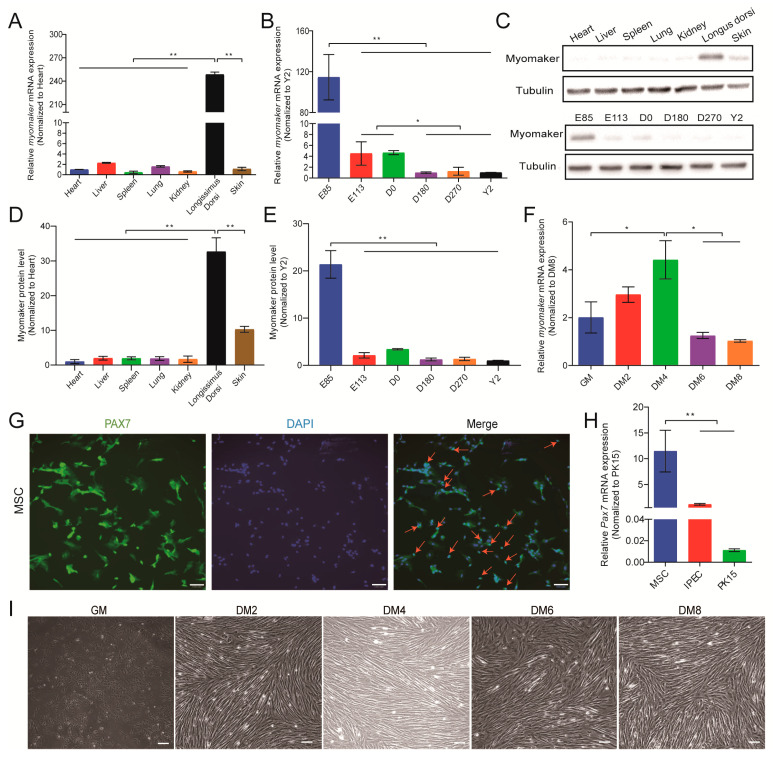
Figure 2.
Patterns of Myomaker expression during pig skeletal muscle development. (A) Relative mRNA expression of Myomaker in representative tissues (Heart, Liver, Spleen, Lung, Kidney, Longissimus dorsi and Skin) of E85 pig, β-actin and GAPDH were used as reference genes; (B) Relative mRNA expression levels of Myomaker in pigs at different ages (E85: Embryonic Day 85; E113: Embryonic Day 113; D0: Day 0 of life; D180: Day 180 of life; D270: Day 180 of life; Y2: year 2 of life); (C–E) Protein levels of Myomaker at different tissues and ages were detected by Western blot and normalized to Tublin. (F) Relative mRNA expression levels of Myomaker during proliferation (GM: Growth medium, 50%) and differentiation (DM2: Differentiation culture for 2 days; DM4: Differetiation culture for 4 days; DM6: Differentiation culture for 6 days; DM8: Differentiation culture for 8 days) of porcine MSCs. (G) Immunofluorescence with an anti-Pax7 antibody. Red arrow, Pax7 specific positive cells in nucleus. Bar, 100 µm; (H) Relative mRNA expression levels of Pax7 in MSCs, IPEC, and PK15; (I) Phase-contrast micrographs of proliferation (GM, 50%) and differentiation (DM2, DM4, DM6, and DM8) of pig MSCs. Bar, 100 µm; Values in A and B are mean ± S.D. with six pigs per group. Values E and G are mean ± S.D. with three cultures per group. ns = not significant; * p < 0.05; ** p < 0.01 compared between corresponding groups.

