Figure 1.
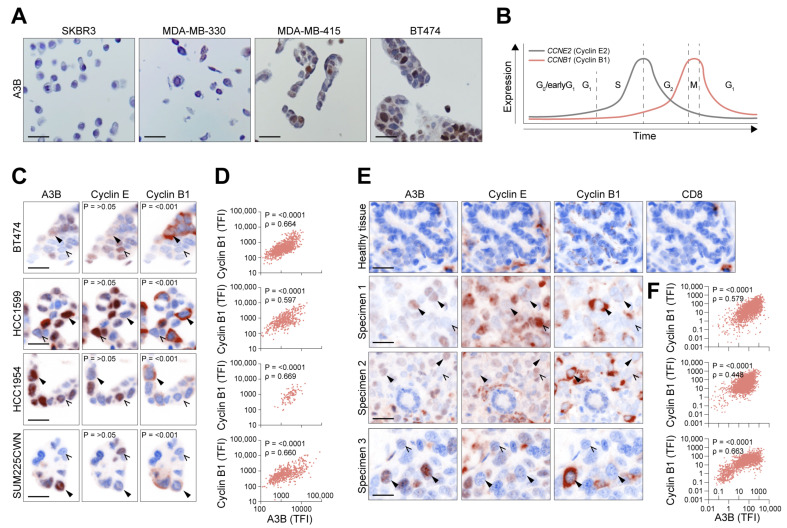
Protein expression of A3B in breast cancer is heterogeneous and correlates with cell cycle proteins. (A) Photomicrographs of A3B using conventional IHC on a diverse set of breast cancer cell lines, including the A3B-null (SKBR3), A3B-low (MDA-MB-330), and A3B-high (MDA-MB-415 and BT474) cell lines. Note the heterogeneous expression pattern of A3B in MDA-MB-415 and BT474. (B) General overview of the various cell cycle phases, overlaid with proteins known to peak during each respective phase. G0/G1 is marked by low expression of both cyclins, while CCNE2 (Cyclin E2) expression rises throughout G1 and into G1/S. Expression of CCNB1 (Cyclin B1) increases during G2 and peaks at mitosis. (C) Photomicrographs showing the subcellular localization of A3B, Cyclin E2, and Cyclin B1 in various A3B-high breast cancer cell lines. Images acquired by multiplex IHC staining. Solid arrowheads indicate cells expressing A3B; open arrows point out cells negative for A3B. P-values are calculated by binomial testing, determining the probability of A3B being co-expressed with individual cell cycle markers. (D) Quantification of (subcellular specific) total fluorescent intensity (TFI) of individual cells as in (C), using Spearman correlation. (E,F) Healthy tissue and three primary breast cancer tumors stained for A3B, Cyclin E2, and Cyclin B1, using the same workflow and analysis presented in (C,D). CD8 staining of healthy tissue is included to account for the sporadic cytoplasmic staining encountered in isolated cells, attributable to A3G expressing tumor-resident leukocytes. Note that detection of A3B protein through regular and multiplex IHC requires separate optimization and antibody concentrations, accounting for the slight difference in staining pattern between these two procedures. Scale bars denote 20 µm. TFI: total fluorescent intensity.

