Figure 4.
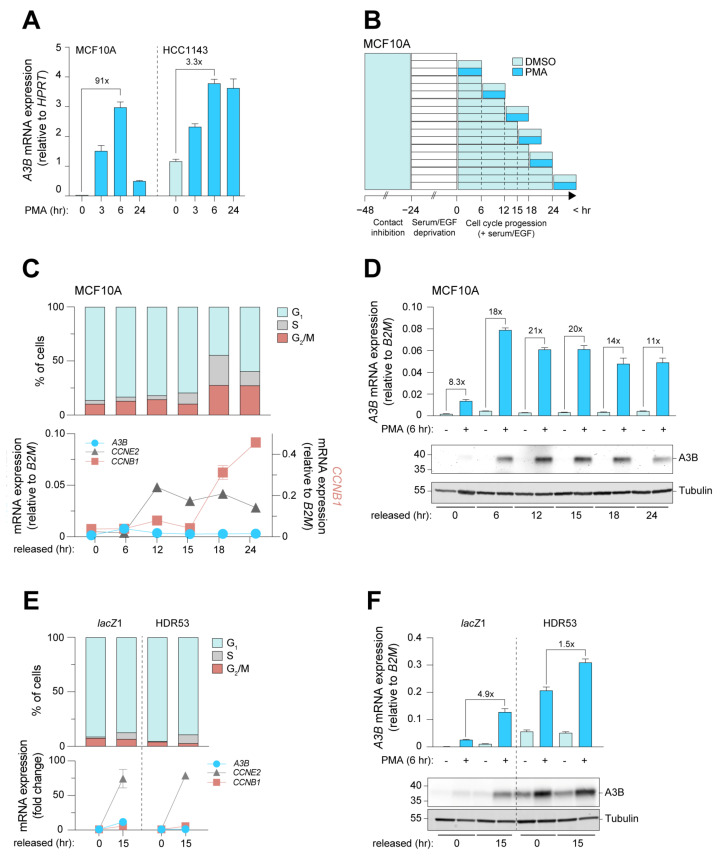
Induction of A3B expression is strongest in actively proliferating cells, and repression during G0 is RB/E2F-dependent. (A) Analysis used to determine the most suitable model for the investigation of PKC/ncNF-κB-induced expression of A3B within the context of cell cycle progression. Unsynchronized MCF10A and HCC1143 cells were exposed to PMA for up to 24 h, during which samples were taken for RT-qPCR analysis. Error bar represents SD. Data represent n = 2 independent experiments. (B) Method used to induce A3B expression using PMA at defined cell cycle stages of MCF10A cells. Teal denotes contact inhibition, followed by growth factor withdrawal (white), cell cycle progression (light blue), and treatment with PMA or vehicle. Samples taken at the start of each PMA or vehicle treatment served as independent controls for cell cycle progression. (C) Cell cycle progression of MCF10A as analyzed by PI staining followed by flow cytometry, and RT-qPCR analysis of A3B, CCNE2, and CCNB1. Error bar represents SD. Data represent n = 2 independent experiments. (D) A3B mRNA (top) and protein (bottom) expression upon PMA treatment during indicated time points following synchronization. Error bar represents SD. Data represent n = 2 independent experiments. (E) Synchronization of lacZ control and MCF10A-HDR53 cells, as analyzed by PI stain and RT-qPCR of A3B, CCNE2, and CCNB1. Gene expression is given as fold change over baseline relative to the cell cycle housekeeping gene B2M. Error bar represents SD. Data represent n = 3 independent experiments. (F) Induction of A3B upon PMA treatment in G0-arrested and actively cycling lacZ control and MCF10A-HDR53 cell lines. Fold changes above the brackets indicate the post-induction levels of A3B in arrested cells with those in actively cycling cells. Error bar represents SD. Data represent n = 3 independent experiments.

