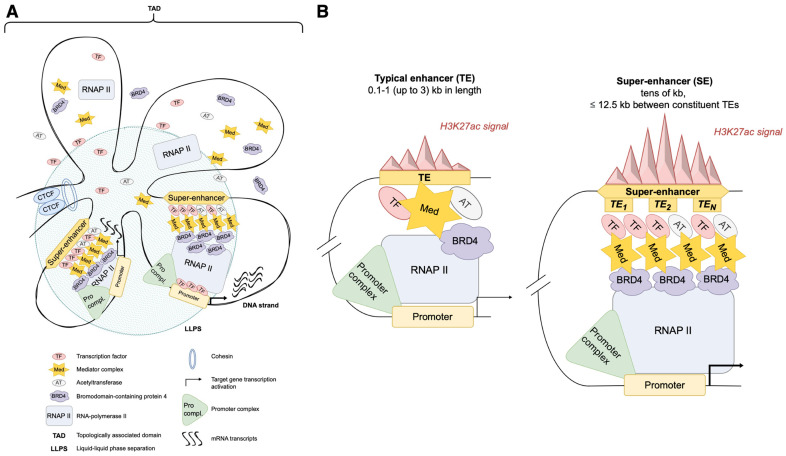
Figure 1.
Schematic representation of the SE concept compared to the TE. (A). LLPS model (blue circle) inside a TAD with two differentially active SEs, which are surrounded by the elements of transcription activation complex and RNAP II. (B). The TE structure, being less lengthy compared to its SE analogues and comprising one distinct TE region, shows moderate levels of H3K27ac signaling.

