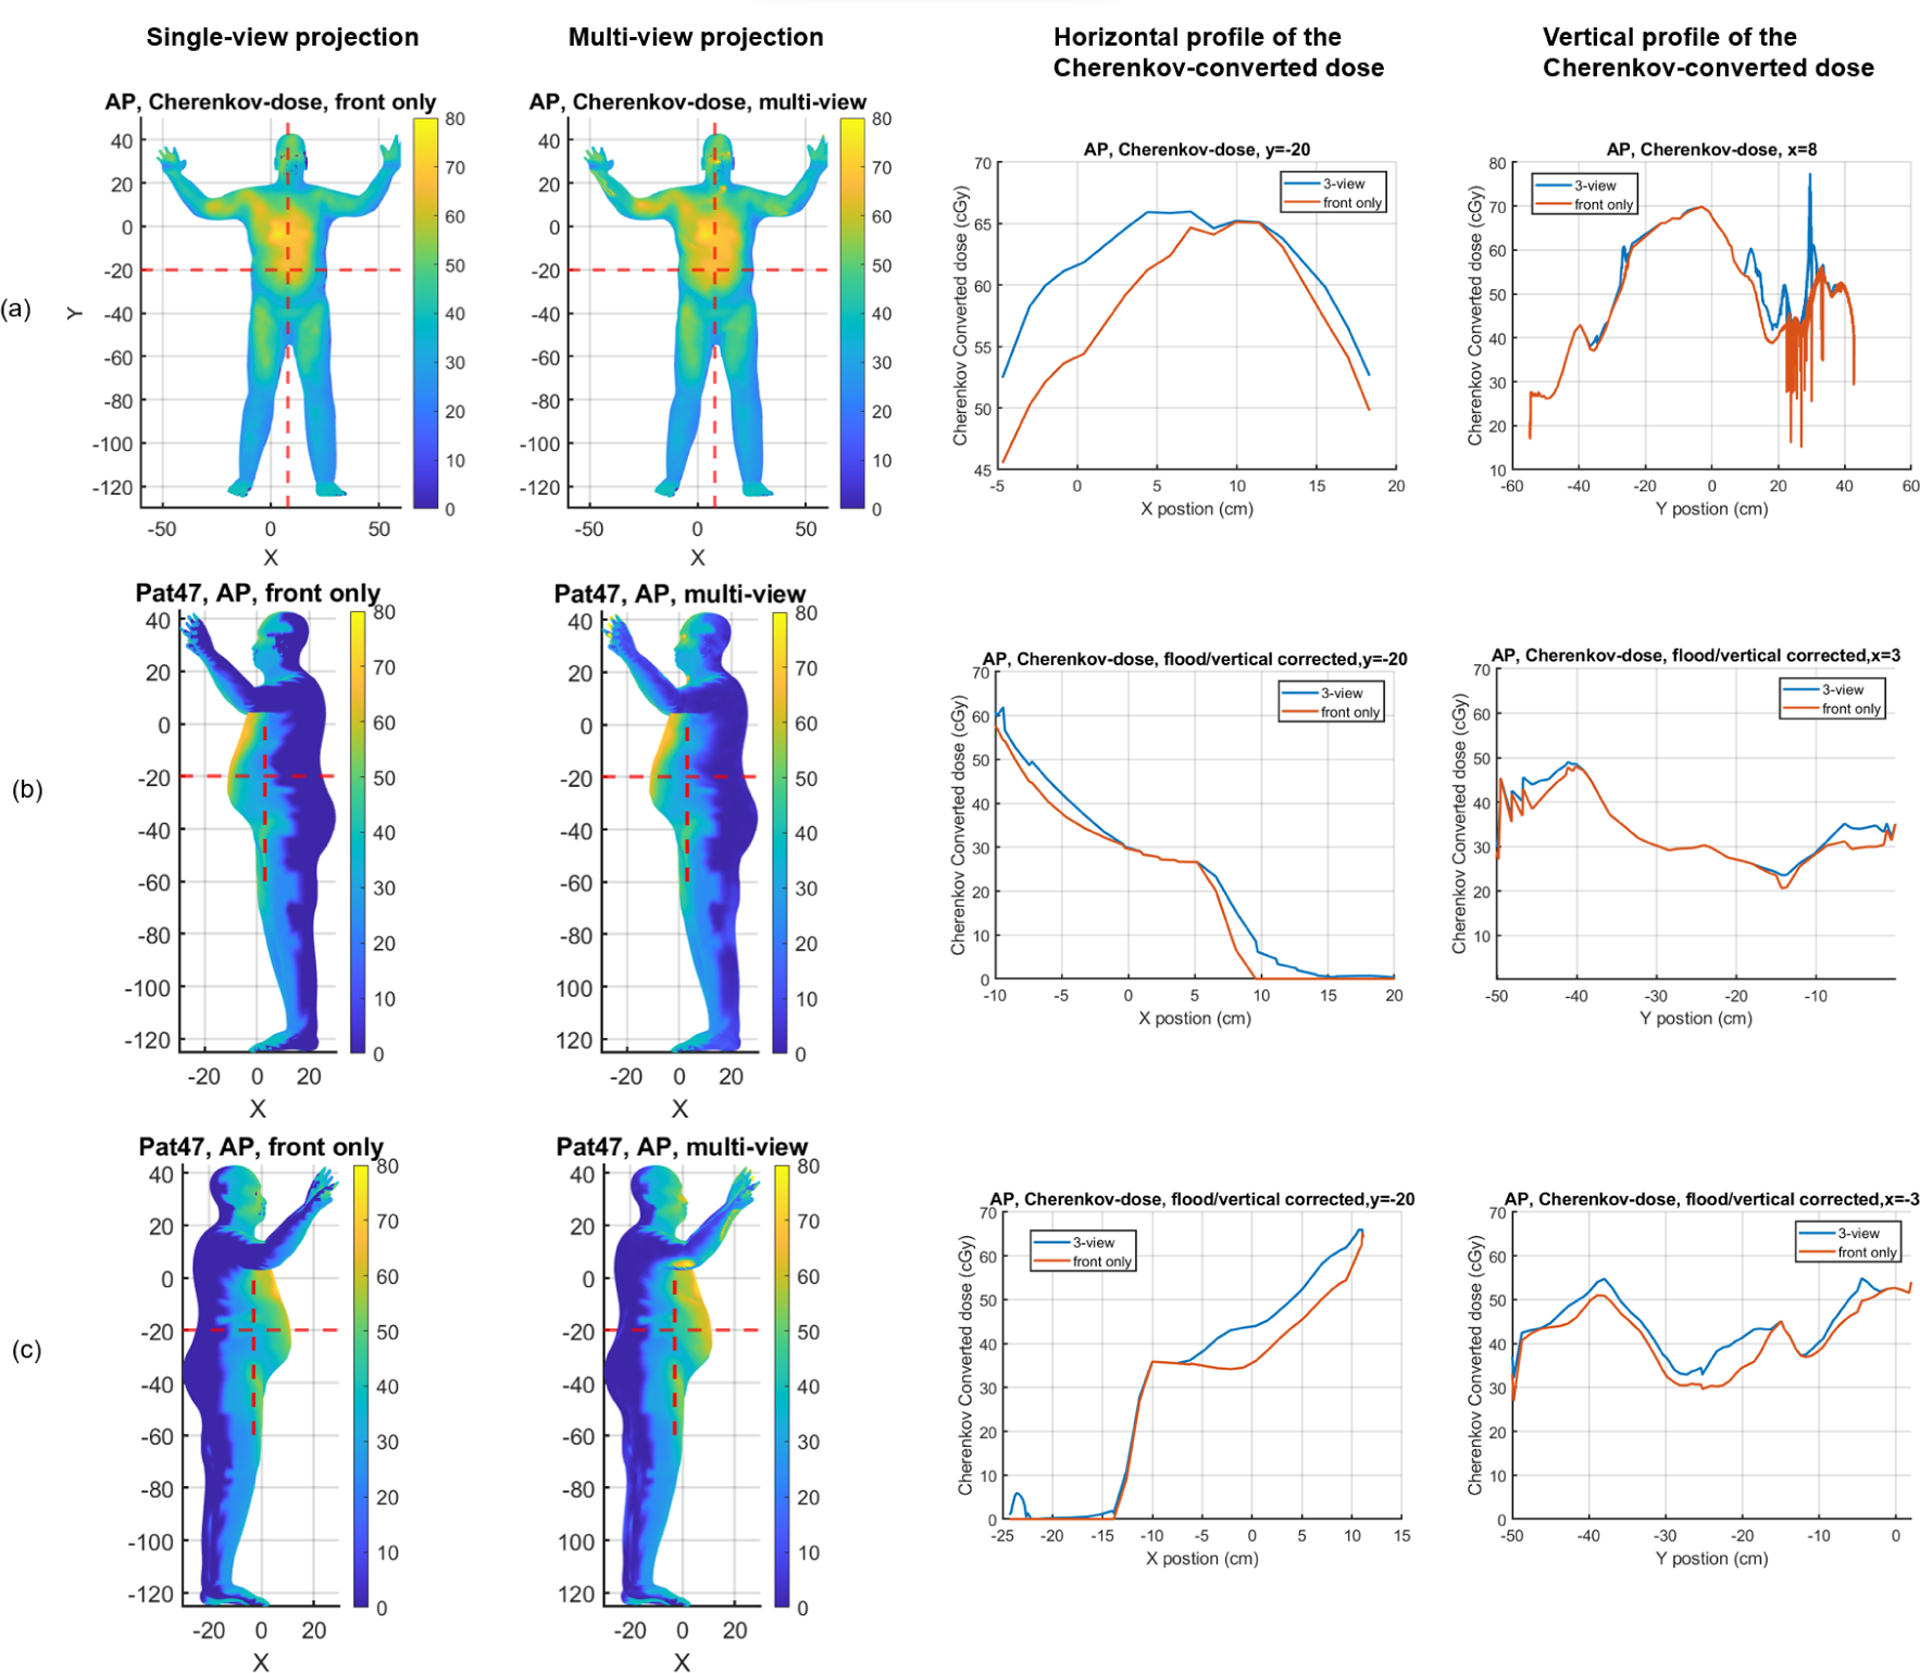
Figure 4.

The comparison of the Cherenkov converted dose for the AP field of patient #47. (a) is the front view, (b) is the patient’s left side view, and (c) is the patient’s right side view. The left two columns are the projected result displayed on the patient’s model using single-view and multi-view methods respectively. The red dotted lines indicate the location where we got the dose profiles. The right two columns are the horizontal and vertical profiles of Cherenkov converted dose on the outer surface of the patient. The blue solid lines are the multi-view projected result and the orange lines are the projected result only using the front view. The unit of colormap is in cGy.
