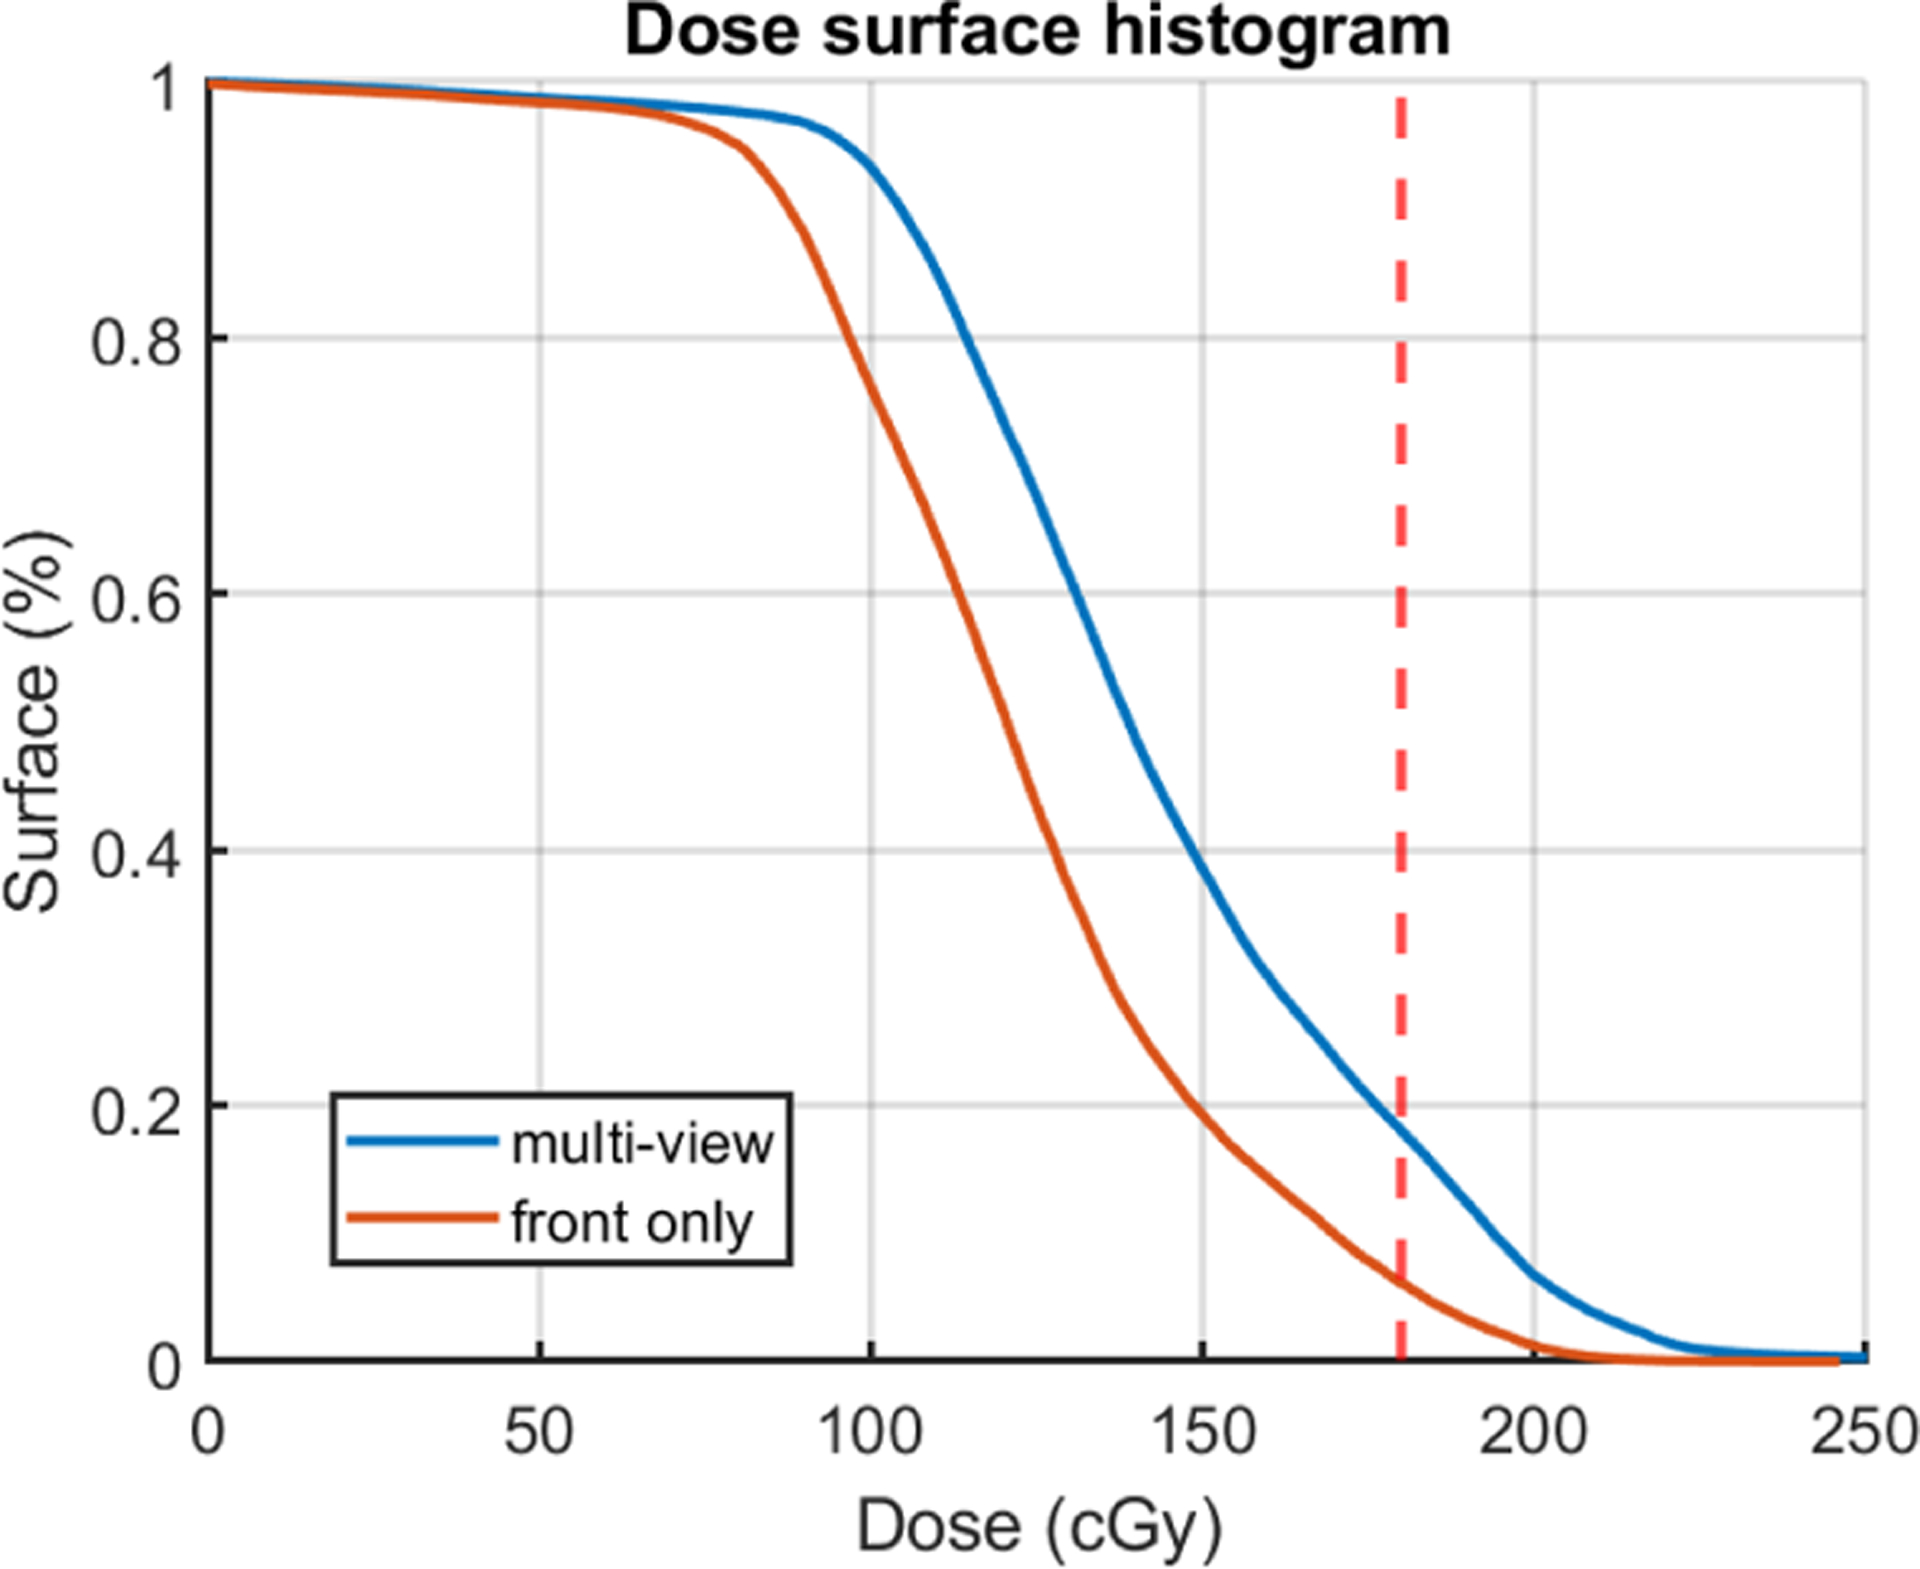
Figure 5.

The dose surface histogram (DSH) of the cumulative Cherenkov converted dose for patient 47 using single-view and multi-view projection. The blue solid lines are the multi-view projected result and the orange lines are the projected result only using the front view.
