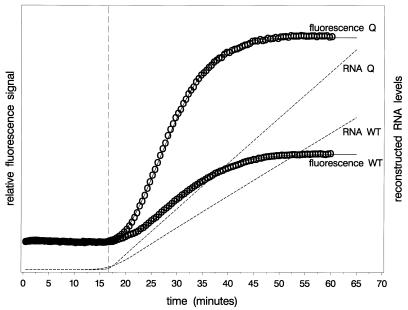
Figure 5.
Example of a test result: two fluorescence curves and reconstructed RNA growth curves. The individual fluorescence measurements are indicated by circles, the fitted fluorescence curves by solid lines and the reconstructed RNA growth curves by dashed lines. The vertical reference line indicates the value of α3.

