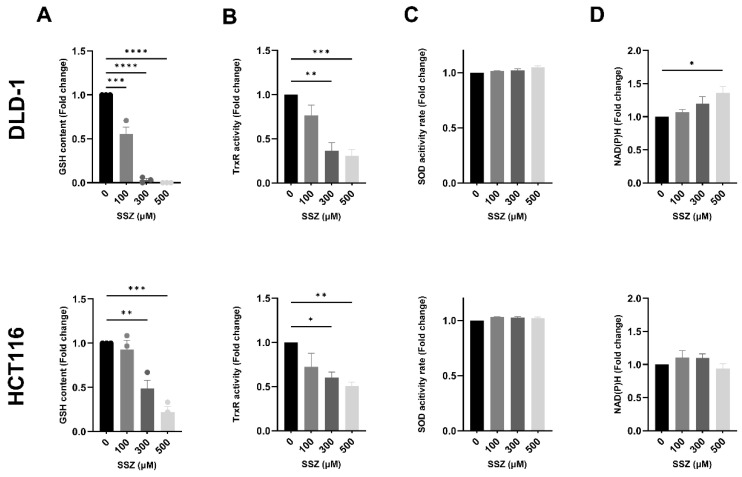
Figure 3.
xCT inhibition severely affects different aspects of redox homeostasis under hypoxic conditions. DLD-1 and HCT116 were treated with SSZ (16 h) under hypoxic conditions (1%), and levels of different antioxidants were determined and normalized to their respective controls. (A) Summarizing graph showing the levels of GSH in DLD-1 (top) and HCT116 (bottom) cell lines. (B) TrxR activity in DLD-1 (top) and HCT116 (bottom) cell lines. (C) SOD activity levels were determined in DLD-1 (top) and HCT116 (bottom) cell lines. (D) NAD(P)H levels were evaluated in DLD-1 (top) and HCT116 (bottom) cell lines. Data are shown as mean ± SEM, n = 3. A one-way ANOVA was performed, followed by Dunnett’s multiple comparison test for statistical analyses. * p < 0.05, ** p < 0.01, *** p < 0.001, **** p < 0.0001.

