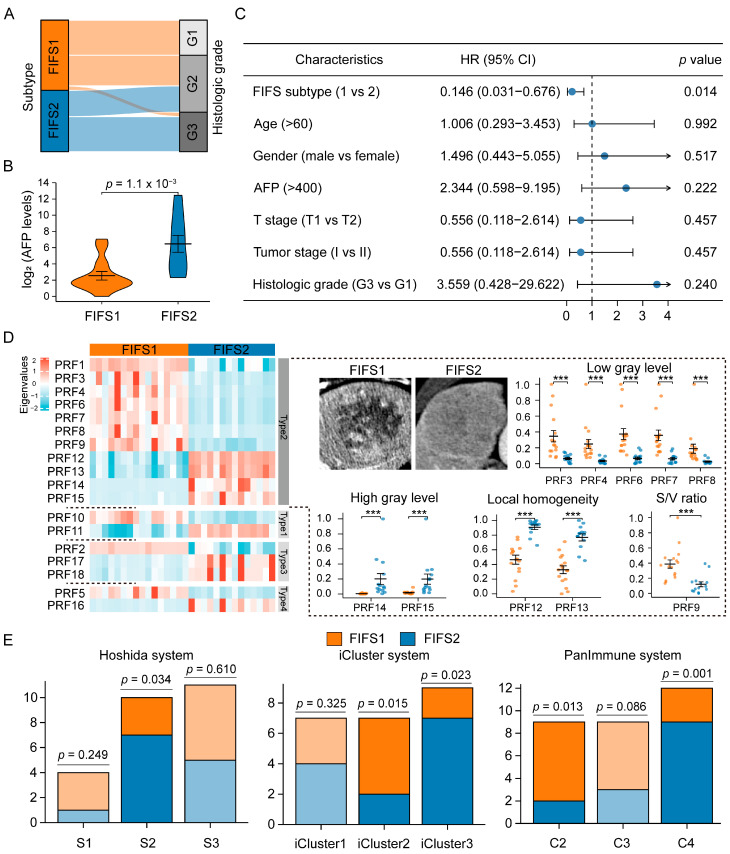
Figure 3.
Clinical and radiomics characterization of radiomics-based subtypes. (A) The alluvial diagram shows the association between radiomics subtypes and histologic grades. (B) The violin plot outlines serum AFP values in FIFS1 and FIFS2, respectively. (C) The result of Cox regression analysis for the FIFS system and clinical risk factors. (D) Heatmap of the eigenvalues’ distribution of PRFs in FIFS1 and FIFS2. The rows are split by imaging feature types according to phase and region information. The representative images in the tumor region of the venous phase (Type 2) of FIFS1 and FIFS2 are presented, and grouped dot plots of PRF eigenvalues are indicated to the right of the heatmap. The eigenvalues of each PRF are row-normalized. ***, p < 0.001. (E) The distribution of three HCC molecular systems in FIFS subtypes. The bar in solid color is statistically significant and the bar in transparent color represents no statistically significant trend. The statistical significance is estimated by hypergeometric tests. S/V ratio, surface–volume ratio.

