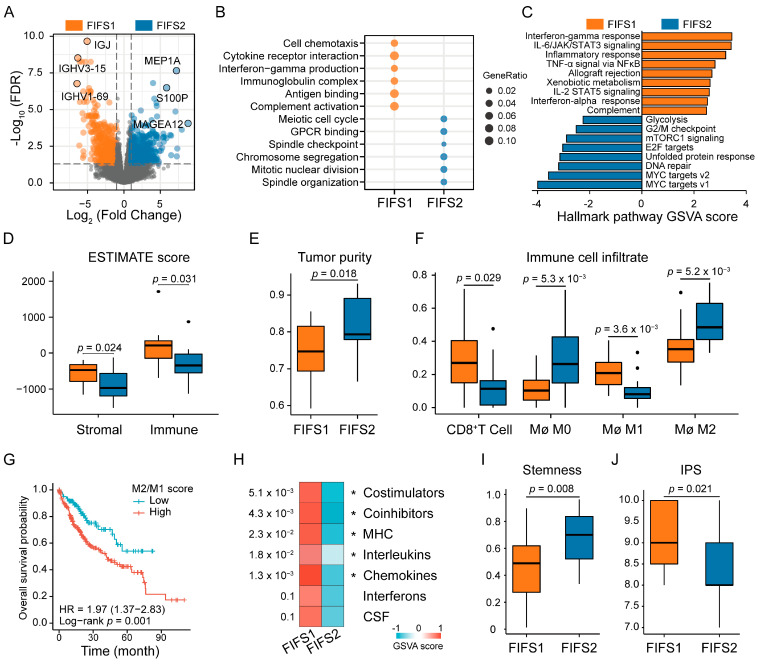
Figure 4.
Radiomics subtypes reveal distinct tumor biological functions and TIME status. (A) The volcano plot shows DEGs between subtypes. The top three significant DEGs are labeled. (B) The dot plot represents the enriched gene sets by GO and KEGG enrichment analysis. (C) Differences in hallmark signatures activities scored by GSVA between FIFS1 and FIFS2. The orange color indicates significantly activated pathways in FIFS1, and the steel blue color indicates significantly activated pathways in FIFS2. (D) Higher stromal scores and immune scores are observed in FIFS1. Dots represent outliers. (E) Tumor purity score across subtypes inferred by the CPE algorithms. (F) Distribution of immune cell infiltration between two subtypes. Dots represent outliers. (G) Kaplan–Meier plot of overall survival rates in TCGA-LIHC samples stratified by M2 macrophages/M1 macrophages ratio. (H) The heatmap shows higher overall expression levels (GSVA scores) of immune-related cell surface molecules (costimulators, coinhibitors, and major histocompatibility complex) and cytokines (interleukins, chemokines, interferons, and colony-stimulating factors) in FIFS1. *, p < 0.05. (I,J) Boxplots show the stemness index (I) and IPS scores (J) in FIFS1 and FIFS2. Mø, Macrophages.

