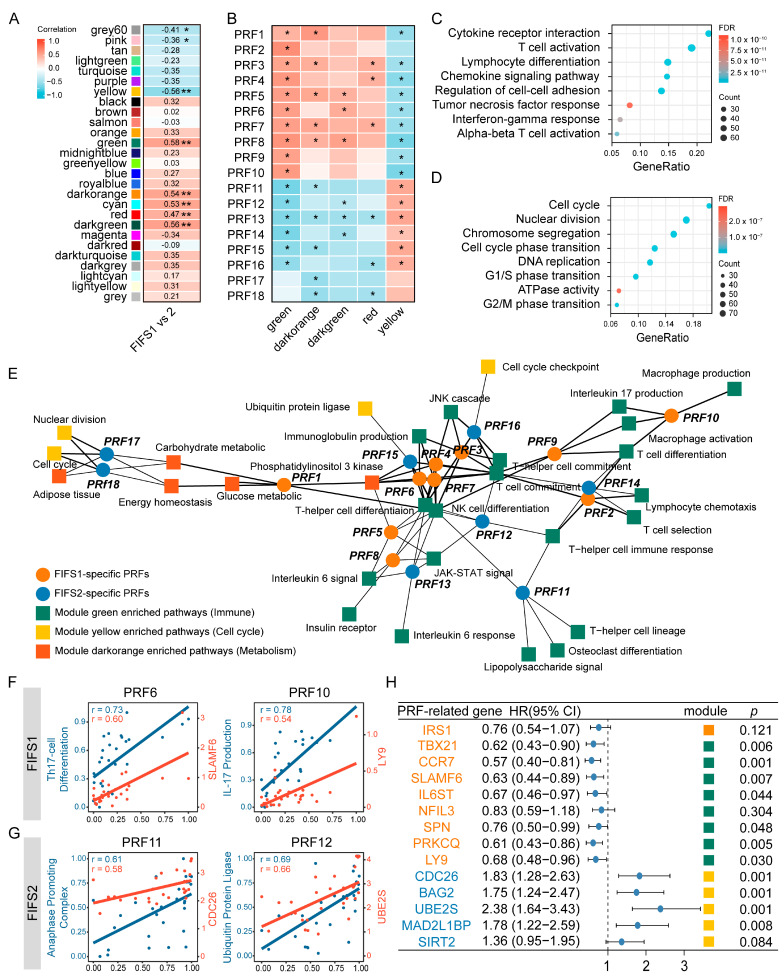
Figure 5.
Radiomics features are associated with immune response and cell cycle modulating function. (A) The correlation matrix between co-expression modules and FIFS subtyping phenotypes. Eight modules are significantly associated with FIFS phenotypes and harbored prognostic values are indicated with an asterisk. *, p < 0.05; **, p < 0.01. (B) Correlations between PRFs and the PRF-related modules are displayed as a heatmap. *, p < 0.05. (C,D) Enrichment analysis results of genes within the green module (C) and the yellow module (D). (E) An association network of the top five pathway–feature pairs for each PRF. The circles in orange and steelblue indicate FIF1-specific and FIF2-specific PRFs, respectively. The squares in green, yellow, and orange indicate the specific biological functions of corresponding color-coded modules. (F,G) The PRFs are significantly correlated with biological functions in FIFS1 (F) and FIFS2 (G). The points in blue indicate the correlation between the most relevant biological pathway and PRFs and the points in red indicate the correlation between the PRF-related genes and PRFs. The correlation coefficients are indicated in the upper left corner of the graph. (H) The forest plot shows the Cox regression result of the PRF-related genes. The genes in orange color indicate the FIFS1-specific PRF-related genes and the genes in steelblue color are FIFS2-specific. Squares are color-coded based on corresponding module color information in (A) and indicate the modules to which PRF-related genes belong.

