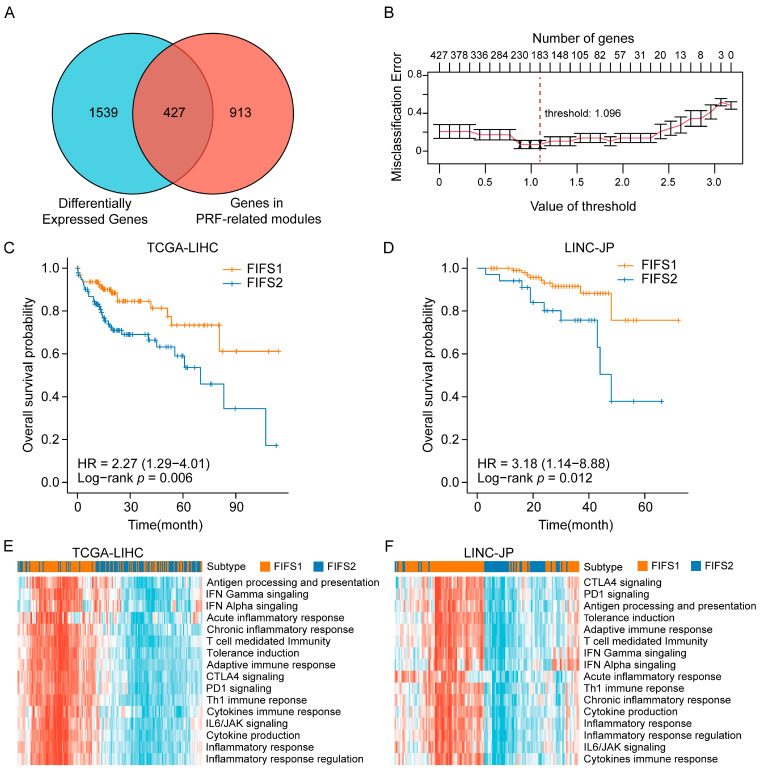
Figure 6.
Independent validation for the immunocompetent status and prognostic relevance based on the FIFS system. (A) Venn diagram shows the overlapping genes between DEGs and the genes of PRF-related modules. (B) The line chart shows the number of candidate genes and misclassification errors at different thresholds. (C,D) Kaplan–Meier survival plots show the overall survival of HCC patients stratified by classifier prediction in the TCGA-LIHC (C) and LINC-JP datasets (D). (E,F) Heatmaps show the innate- and adaptive-immunity-related pathway enrichment scores for patients of FIFS1 and FIFS2 in TCGA-LIHC cohort (E) and the LINC-JP cohort (F). Rows show immune-related pathway enrichment scores (z-scores) and columns show the patients stratified by the classifier.

