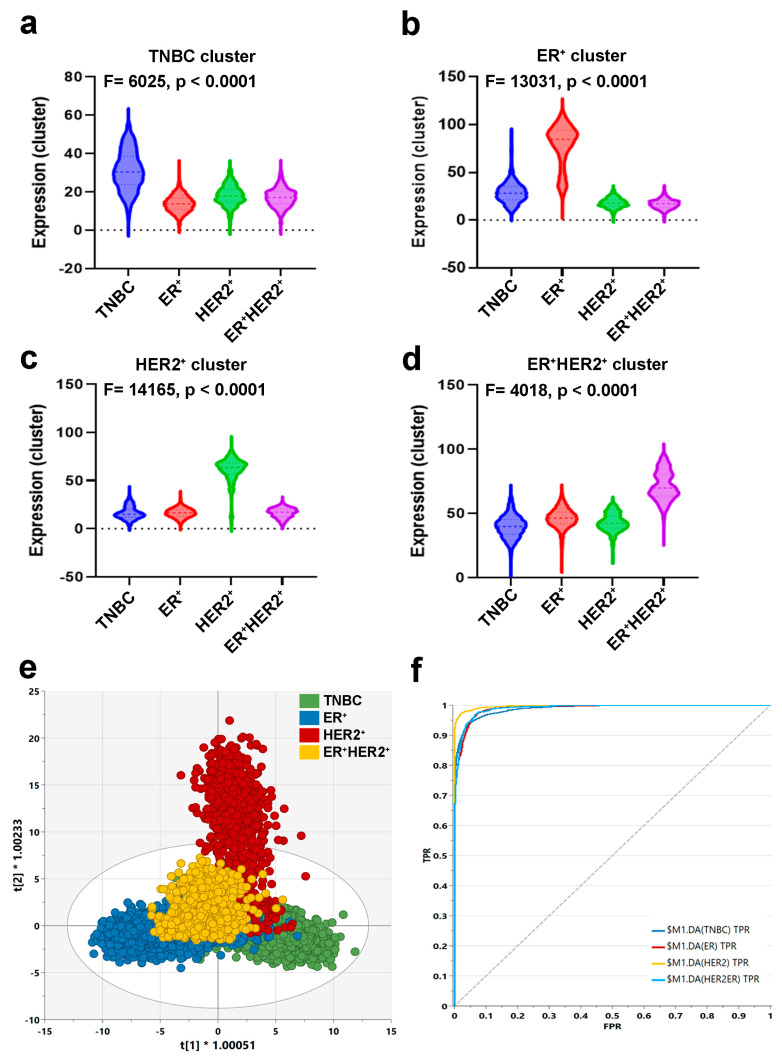
Figure 3.
Discriminative analysis based on the identified gene markers. Anova analysis for the identified gene markers enriched in TNBC (a), ER+ (b), HER2+ (c), and ER+HER2+ (d). Sum score from the identified gene markers for each BC subtype were used for Anova analysis. (e) OPLS-DA score plot for the different BC molecular subtypes based on the identified gene markers. (f) ROC analysis of the identified gene markers comparing the four BC molecular subtypes.

