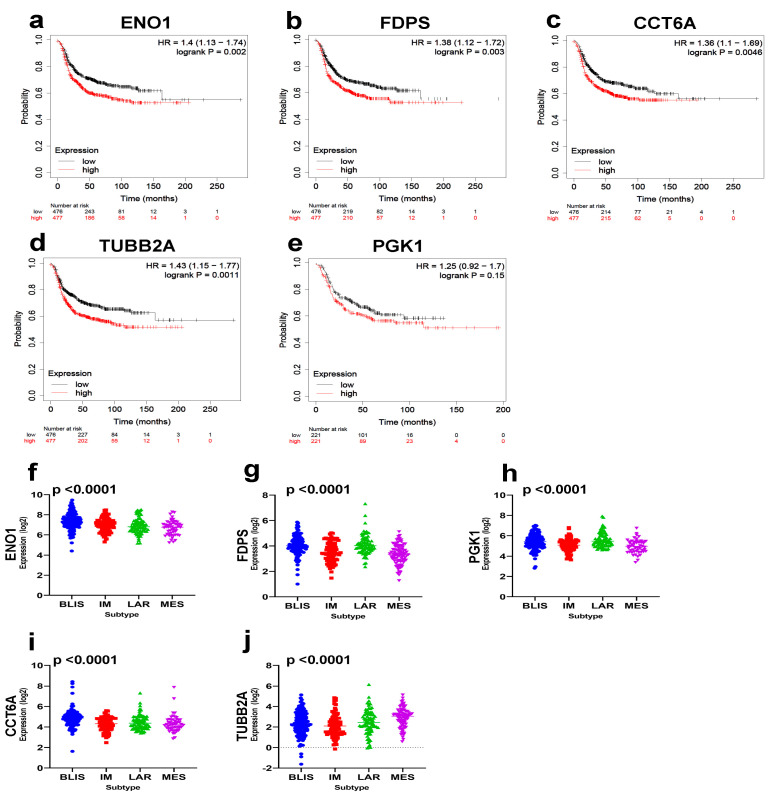
Figure 5.
Prognostic significance of the identified TNBC therapeutic targets. Kaplan-Myer RFS analysis for ENO1 (a), FDPS (b), CCT6A (c), TUBB2A (d), and PGK1 (e) based on median expression in a cohort of 442 basal BCs. Log–rank p value is indicated on each plot. Expression of ENO1 (f), FDPS (g), PGK1 (h), CCT6A (i), and TUBB2A (j) as a function of TNBC molecular subtypes in an independent cohort of TNBC (n = 360). Anova p value is indicated on each plot.

