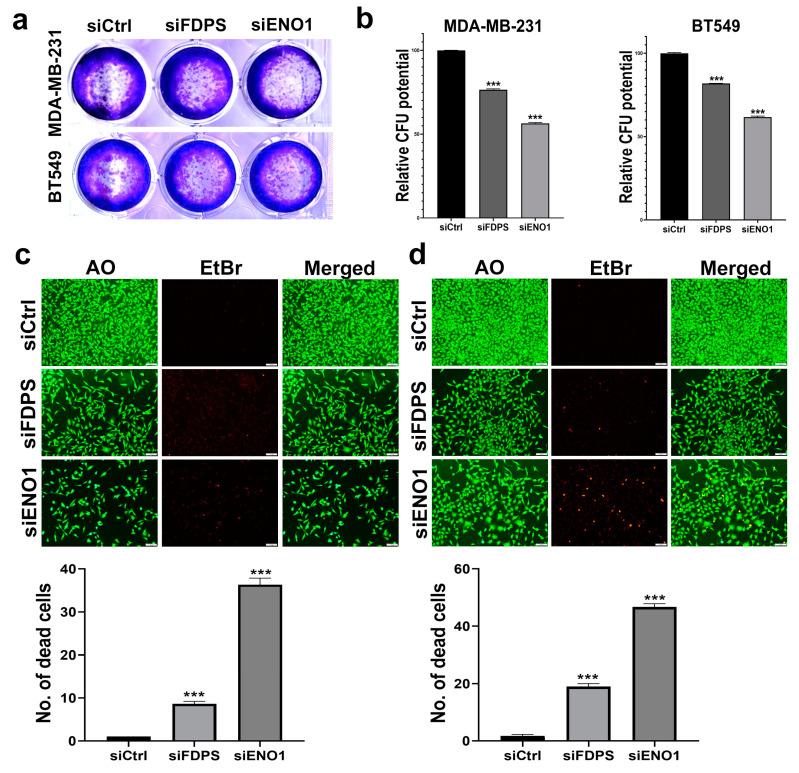
Figure 6.
Colony formation and viability assessment of TNBC cells models in response to ENO1 and FDPS depletion. CFU of MDA-MB-231 and BT-549 in response to FDPS and ENO1 depletion (a). Quantification of CFU in MDA-MB-231 and BT-549 in response to FDPS and ENO1 depletion (b). Data are presented as means ± S.E., n = 3. *** p < 0.0005. Upper panels show representative live (green) and dead (red) staining of MDA-MB-231 (c) and BT-549 (d) in response to FDPS and ENO1 depletion. (Scale bar = 1000 μM). Quantification of the number of dead (red) cells under each treatment condition is shown in lower panels. Data are shown as mean number of dead cells in three different fields (10×) ± S.D, n = 3. *** p < 0.0005.

