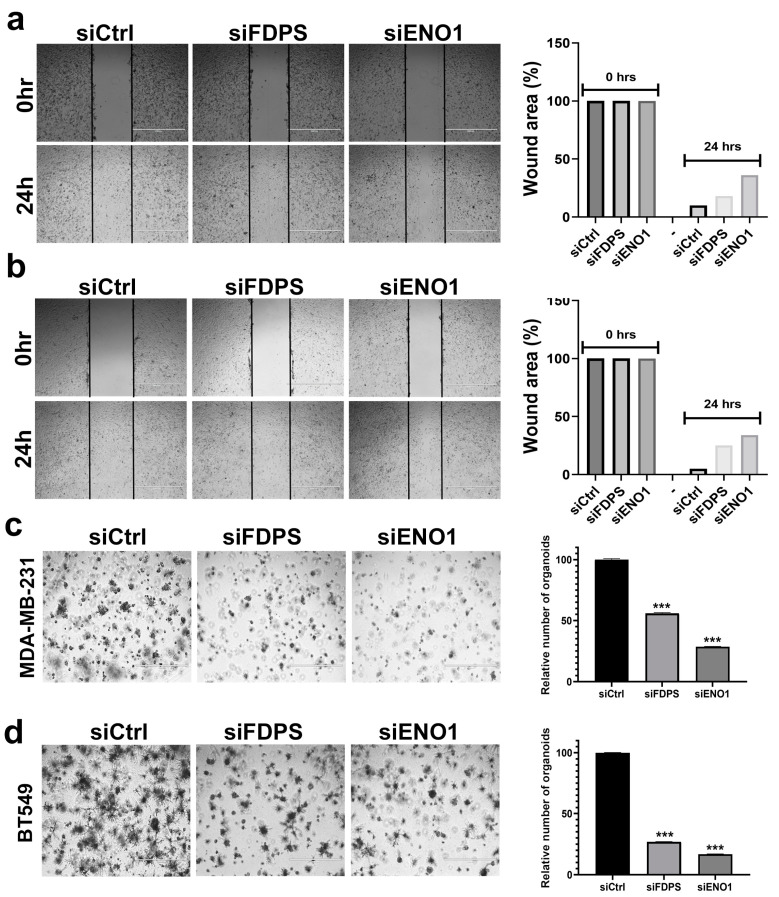
Figure 7.
Targeted depletion of FDPS and ENO1 reduces migration and organotypic growth of TNBC cell models. Cell migration (scratch assay) for MDA-MB-231 (a) and BT-549 (b) TNBC cell models in response to FDPS and ENO1 depletion. Quantification of relative (%) wound area under each treatment condition is shown in the right panels. Inhibition of 3D organoid formation of MDA-MB-231 (c) and BT-549 (d) TNBC models in response to FDPS and ENO1 depletion. (Scale bar = 1000 μM). Quantification of number of organoids under each treatment condition relative to control is shown in the right panels. Data are shown as mean relative number from three different fields (10×) ± S.D, n = 3. *** p < 0.0005.

