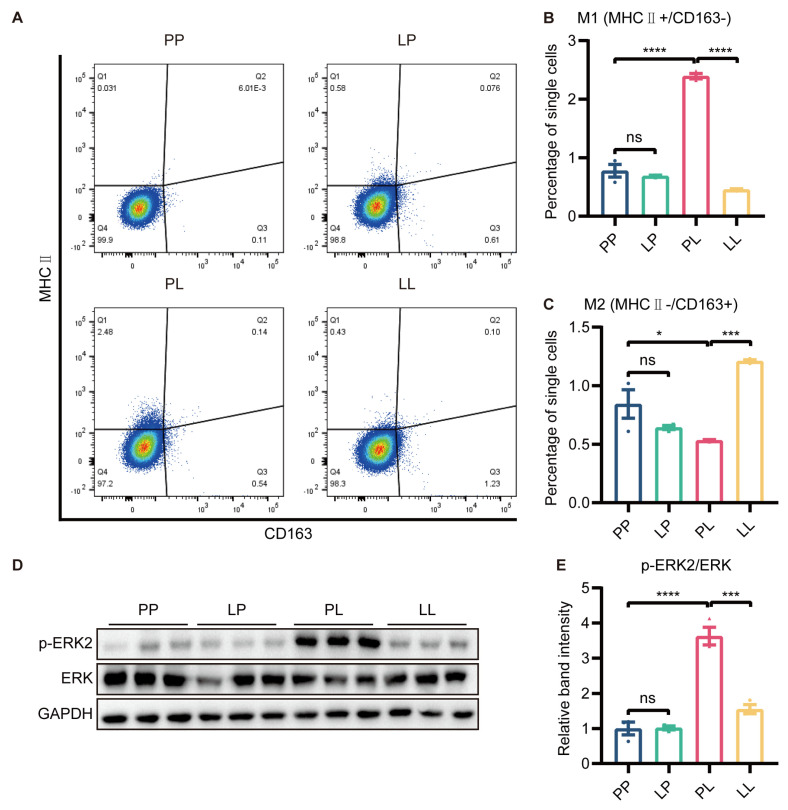
Figure 5.
The effect of low−dose LPS pretreatment on phenotypic transition in BV2 microglia. (A) Representative graph of flow cytometry results. MHC Ⅱ and CD163 were used to identify M1 and M2 microglia, respectively. MHC Ⅱ (B) and CD163 (C) protein expression was measured via flow cytometry. M1 microglial polarization was reduced and M2 microglial polarization was promoted in the LL group compared to the PL group (n = 3). (D) Representative Western blots of p−ERK2 and ERK in BV2 microglia; the level of each protein was normalized to the GAPDH level (n = 3). (E) Statistical analysis showed that the phosphorylation of the ERK protein in BV2 microglia was decreased in the LL group compared to the PL group. The data were presented as the mean ± SEM; one-way ANOVA, ns indicated no significance, * p < 0.05; *** p < 0.001; **** p < 0.0001.

