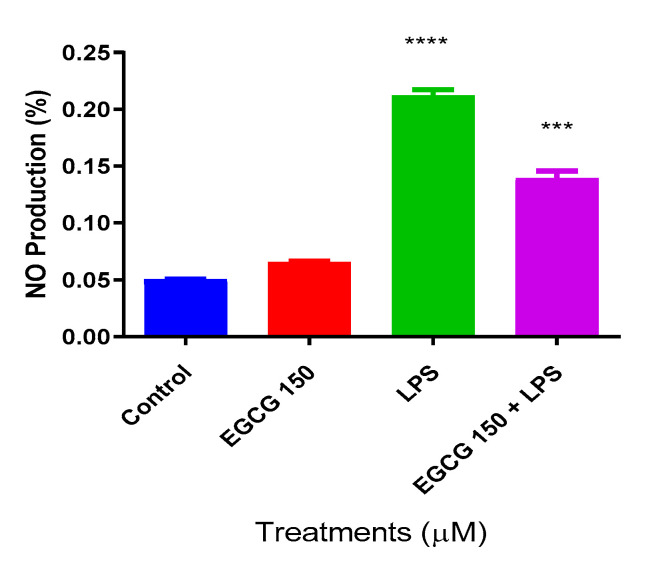
Figure 2.
EGCG caused a concentration-dependent decrease in nitric oxide (NO) production. Griess reagent assay was used to measure nitric oxide (NO) production. The X-axis represents the different treatment conditions for BV-2 cells, while the Y-axis shows NO production (%). EGCG 150 µM showed no significant change when compared to the control. EGCG 150 µM paired with 1 µg/mL of LPS significantly reduced NO generation compared to LPS. LPS (1 µg/mL) showed a 45% increase in NO production when compared to the controls (EGCG 150 µM alone and no treatment control), whereas the EGCG 150 µM with 1 µg/mL LPS displayed a 25% decrease in NO generation. Values represent the mean ± SD, *** p ≤ 0.001, and **** p ≤ 0.0001 vs. LPS.

