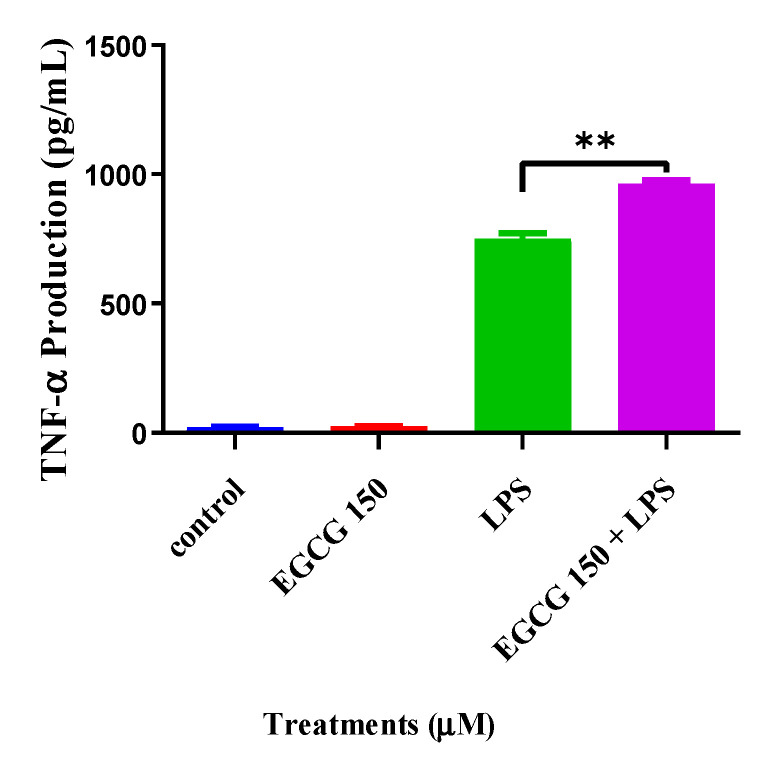
Figure 4.
EGCG concentrations at 150 µM coupled with 1 µg/mL LPS increase TNF-α. Individual ELISA analysis of BV-2 cells shows that EGCG at 150 µM and LPS (1 µg/mL) had a 2% increase of TNF-α compared to LPS (1 µg/mL). LPS 1 µg/mL increased TNF-α by 30%. EGCG 150 µM alone showed no significant change and was similar to the control (untreated cells). Values represent the mean ± SD, ** p ≤ 0.01 vs. LPS.

