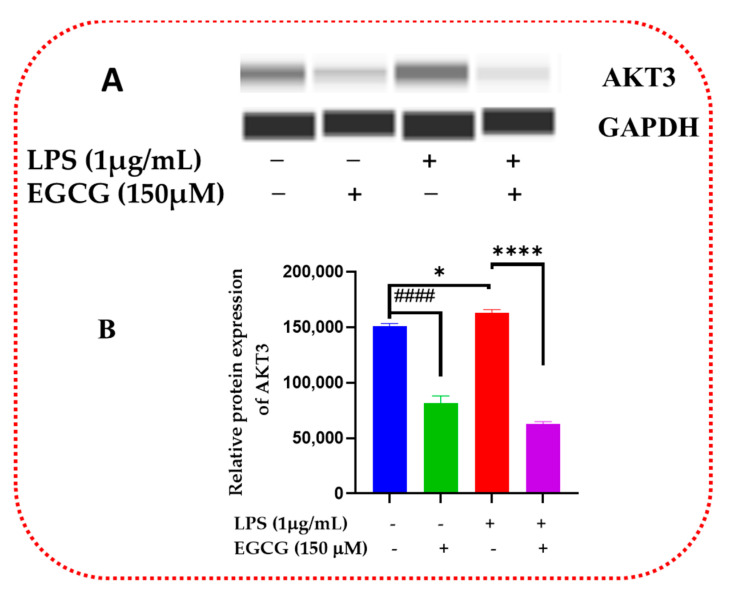
Figure 16.
EGCG decreased the relative protein expression of Akt3. Western blot representative image of AKT3 shows that EGCG 150 µM coupled with LPS 1 µg/mL displayed in bands in (A) and graph in (B) reduced protein expression of the aforementioned analyte compared to LPS (red). EGCG 150 µM alone also decreased NF-κB2 protein expression. GAPDH was used as a loading control. Values represent the mean ± SD, * p ≤ 0.05, and **** p ≤ 0.0001 vs. LPS, #### p < 0.0001 vs. control.

