Figure 4.
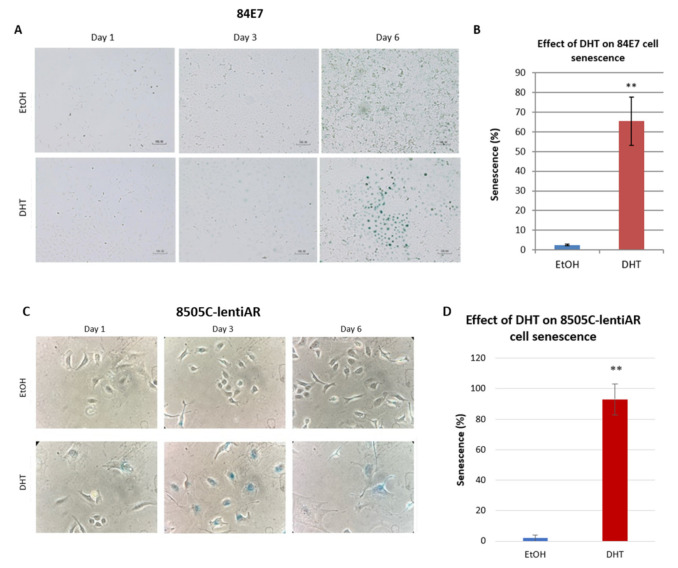
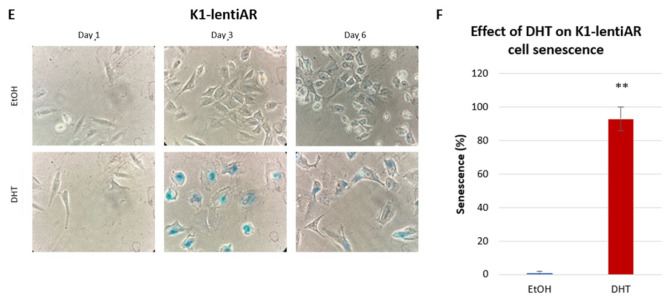
Effect of AR activation on SAβG accumulation: (A) AR activation of 84E7 drove significant SAβG accumulation. Top panel shows EtOH-treated 84E7 cells, which exhibited non-specific blue staining for beta-gal. Bottom panel shows blue staining of lysosomes in 84E7 cells treated with 10 nM DHT. (B) Quantification of increased senescence-associated beta-galactosidase expression in AR-activated 84E7 cells. (C) AR activation drove significant SAβG accumulation in 8505C-lentiAR when compared to EtOH-treated control cells. (D) Quantification of increased senescence-associated beta-galactosidase expression in AR-activated androgen-responsive 8505C-lentiAR cells. (E) AR activation drove significant SAβG accumulation in K1-lentiAR when compared to EtOH-treated control cells. (F) Quantification of increased senescence-associated beta-galactosidase expression in AR-activated androgen-responsive K1-lentiAR cells. The asterisks denote a statistically significant difference between the two groups (** p < 0.005). Images were taken at 20× magnification (A) and 40× magnification (C,E).


