Figure 6.
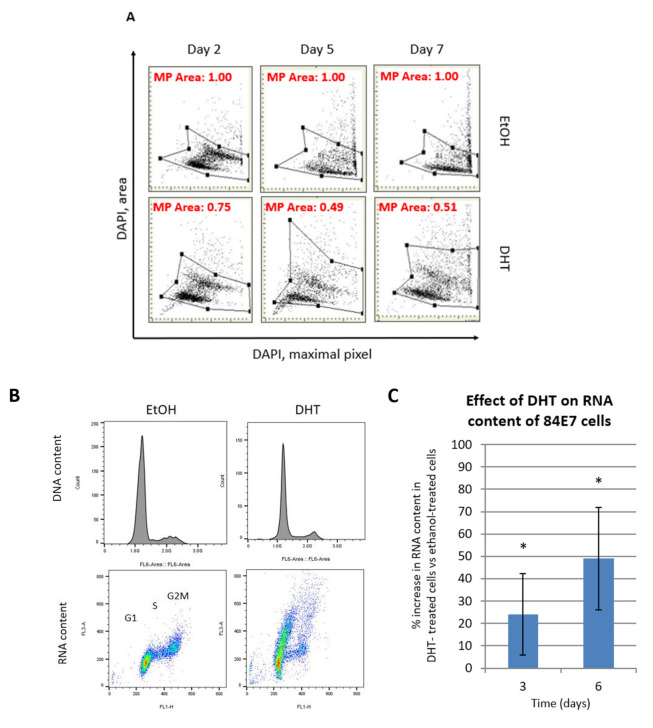
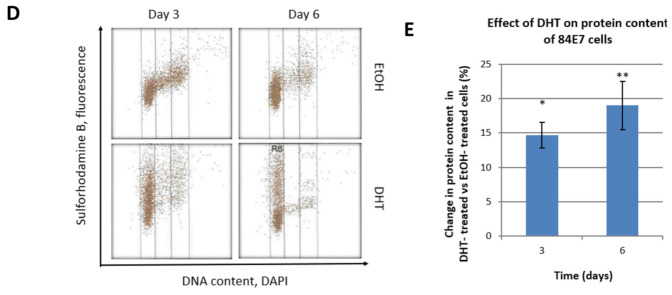
Effect of AR activation on 84E7 nuclear area, DNA, RNA, and protein content. (A) Analysis of nuclear changes, measured via laser scanning cytometry, revealed that the ratio of maximum pixels (MP) of DAPI fluorescence per nucleus to the nuclear area decreased, and indicated that the nuclear area increased as the ARs were activated for longer periods of time. (B) Flow cytometry demonstrated an increase in total RNA content in 84E7 cells treated with DHT on day 6, as measured via acridine orange staining. DNA histograms demonstrate G1 arrest typical for senescence. (C) Quantification of the flow cytometry data revealed a significant 23% and 49% increase in RNA in DHT-treated 84E7 cells over EtOH-treated controls on days 3 and 6. (D) Flow cytometry demonstrated an increase in total protein content in 84E7 cells treated with DHT on days 3 and 6, as measured via sulforhodamine B staining. (E) Quantification of the flow cytometry data revealed a significant 14.67% and 19% increase in cellular protein in DHT-treated 84E7 cells over control on day 3 and day 6, respectively (* p-value < 0.05, ** p-value < 0.005).


