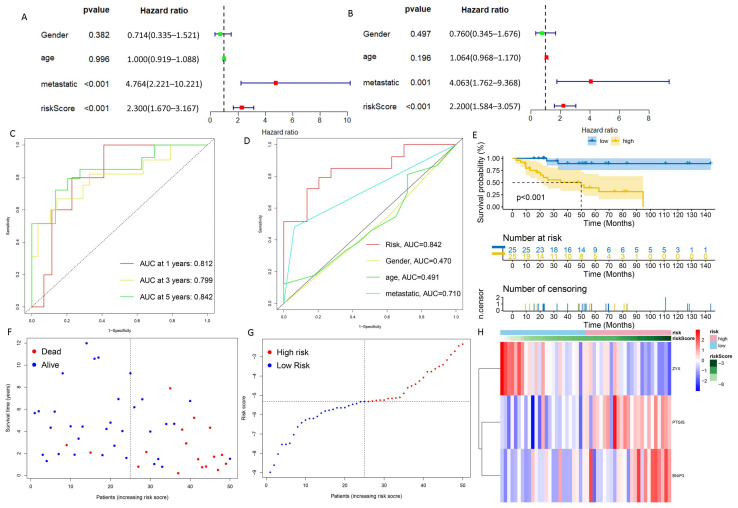
Figure 3.
Evaluation of DGPS. (A) Univariate Cox analysis. Risk score and metastasis were statistically significant. (B) Multivariate Cox analysis. (C) ROC curve of DGPS in training group. (D) ROC demonstrating that the predictive accuracy of DGPS was superior to the other clinical parameters in the training set. (E) Kaplan–Meier curves of overall survival in the training set. (F,G) Distribution of risk scores and distribution of overall survival status and risk score in the training set. Blue: low risk; red: high risk. (H) Heatmap indicating the expression degrees of BNIP3, PTGIS, and ZYX in the training set. ROC curve, receiver operating characteristics curve; AUC, area under the curve; p < 0.05, statistically significant.

