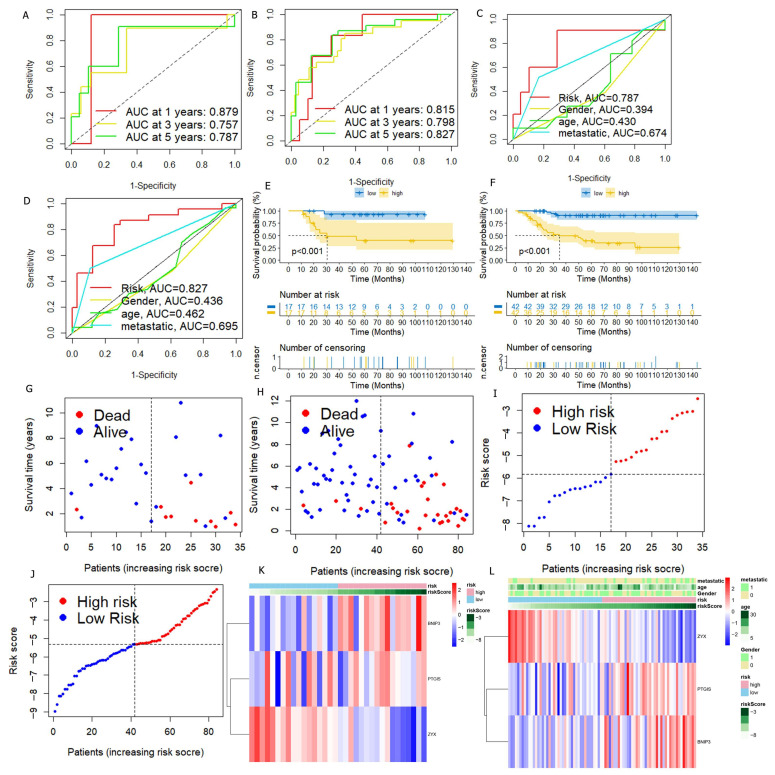
Figure 5.
Verification of DGPS. ROC curve of DGPS in the test set (A) and in the entire cohort (B). ROC demonstrated that the predictive accuracy of DGPS was superior to that of other clinical characteristics in the test set (C) and in the entire cohort (D). Kaplan–Meier curves of overall survival (OS) in the test set (E) and in the entire cohort (F). Survival status of patients with osteosarcoma in the test set (G,I) and in the entire cohort (H,J). Blue: low risk; red: high risk. The heatmap indicates the expression degrees of BNIP3, PTGIS, and ZYX in the test set (K) and in the entire cohort (L).

