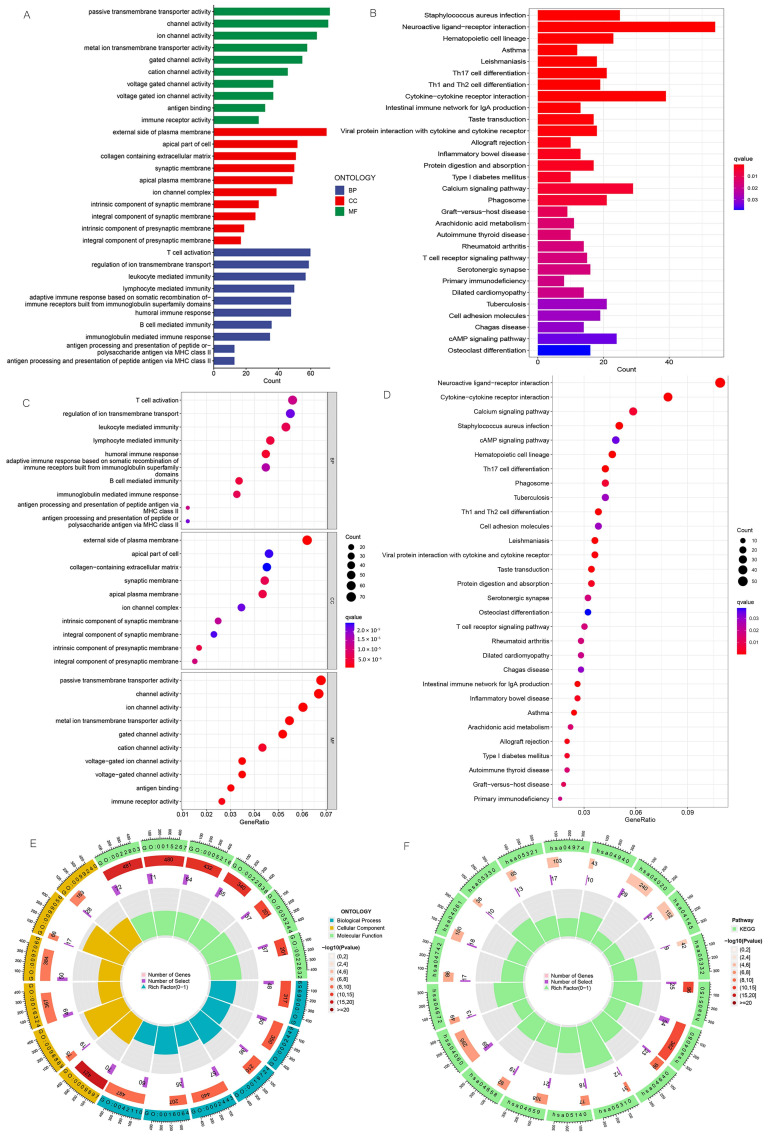
Figure 10.
GO and KEGG pathway enrichment analyses. (A) Bar plot of the top 10 GO enrichment terms. (B) Bar plot of the top 30 KEGG enrichment terms. (C) Bubble chart of the top 10 GO enrichment terms. (D) Bubble chart of the top 30 KEGG enrichment terms. (E) Circle diagram of GO enrichment analysis. (F) Circle diagram of KEGG enrichment analysis. GO enrichment terms include biological process, cellular component, and molecular function.

