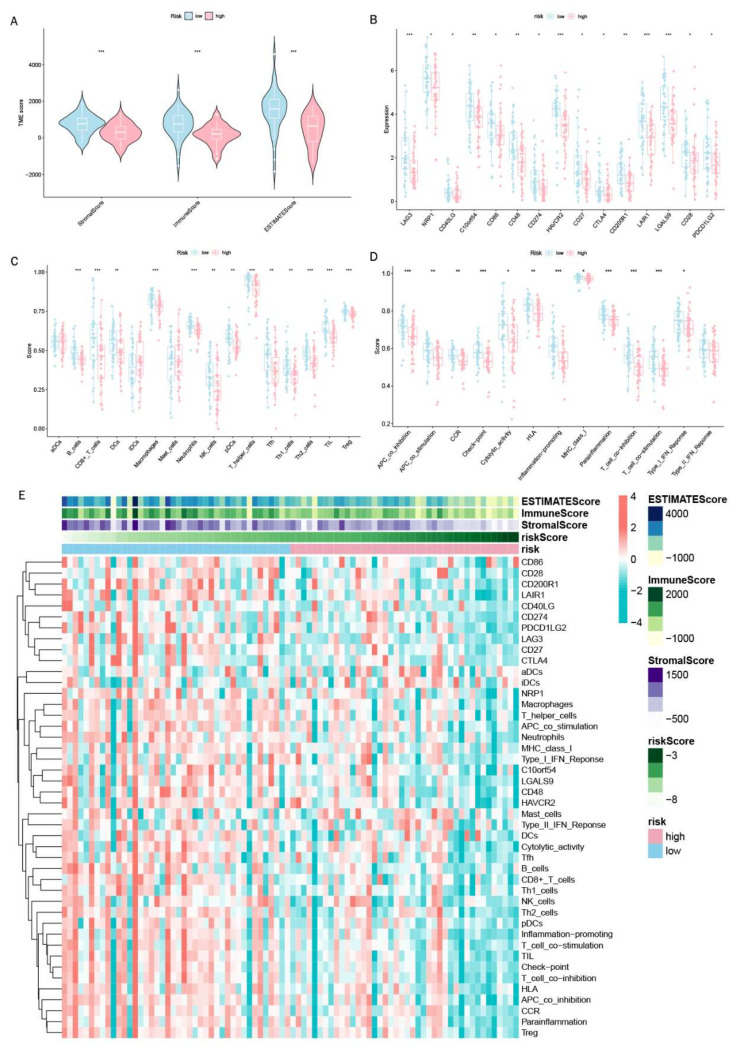
Figure 11.
Immunoassay showing that DGPS is closely related to the immune system. (A) Analysis of TMB differences between high- and low-risk groups of patients with osteosarcoma. Box plots of the ssGSEA scores of 15 immune checkpoints (B), 13 immune cells (C), and 12 immune-related functions (D) between different risk groups. (E) Heatmap showing the landscape of immune characteristics and the tumor microenvironment in the TARGET cohort determined by the ssGSEA algorithm. “*”represented “p < 0.05”,“**”represented “p < 0.01”,“***”represented “p < 0.001”.

