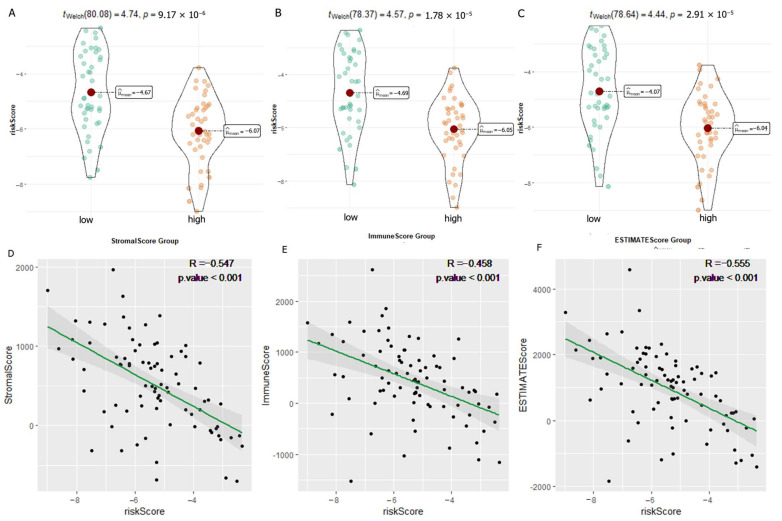
Figure 14.
Correlation analysis of immune-related scores and risk scores. (A–C) Analysis of the variability of risk scores among different StromalScore (A), ImmuneScore (B), and ESTIMATEScore (C) subgroups. (D–F) Scatter plots of correlations between risk scores and StromalScore (D), ImmuneScore (E), and ESTIMATEScore (F).

