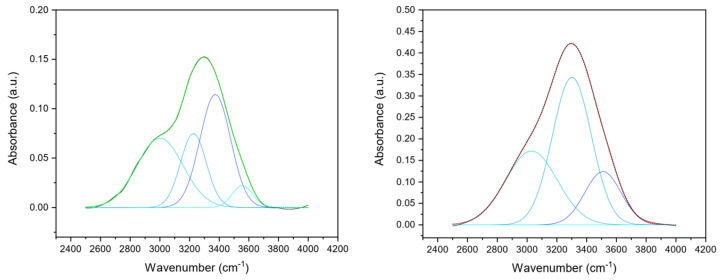
Figure 3.
Gaussian deconvolution of FTIR spectrum of UN (left) and DHT (right) collagen film in the ν (OH) region in four components, corresponding to the H-bond distance of 0.25 nm (octane line, at about 3110 cm−1), 0.28 nm (sky blue line, at about 3250 cm−1), 0.29 nm (blue line, at about 3460 cm−1) and 0.31 nm (teal line, at about 3670 cm−1). The fitted curve is shown as the green (UN) or red (DHT) line, closely overlapping the experimental curve (black line).

