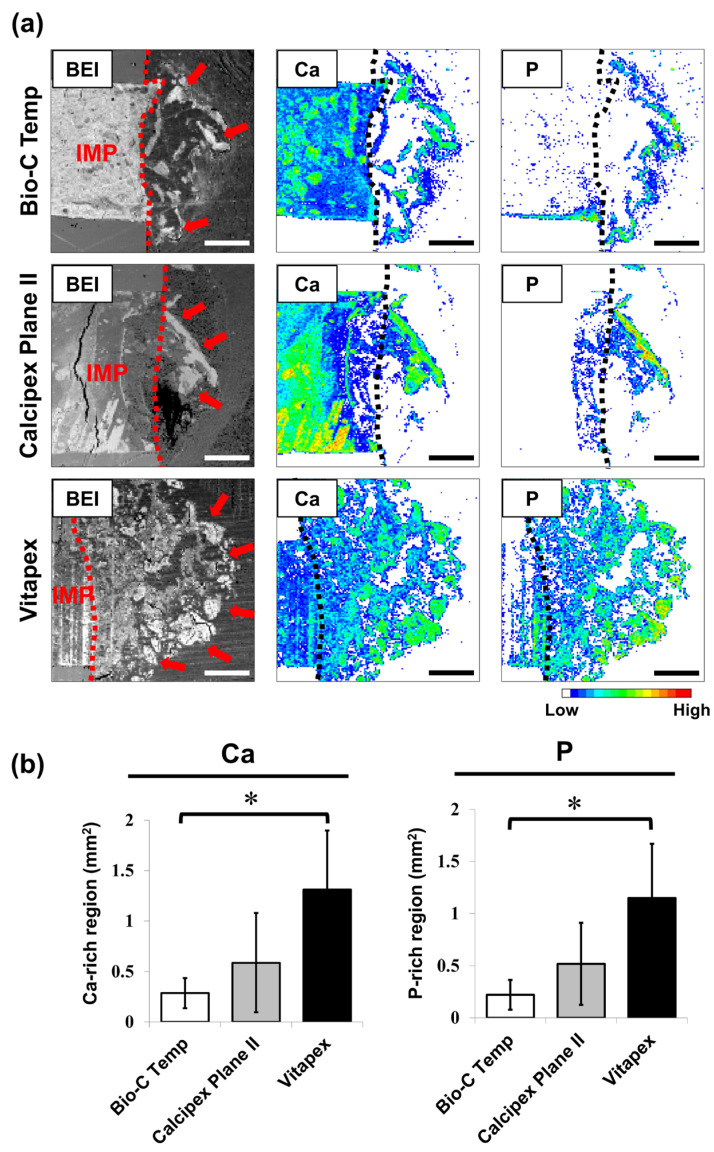
Figure 4.
Degree of calcium salt formation around the Bio-C Temp, Calcipex Plane II, and Vitapex implants. (a) Representative backscattered electron images (BEI) and elemental mapping images of the subcutaneous tissue–implant interfaces. Dotted lines indicate the surface of the implants. Arrows indicate the calcium (Ca)- and phosphorus (P)-rich calcified regions in the subcutaneous tissue. (b) Average area sizes of the Ca-rich and P-rich regions within the subcutaneous tissue. Data are presented as means ± SD (Tukey’s test, n = 5, * p < 0.05). Scale = 500 μm. IMP: implant.

