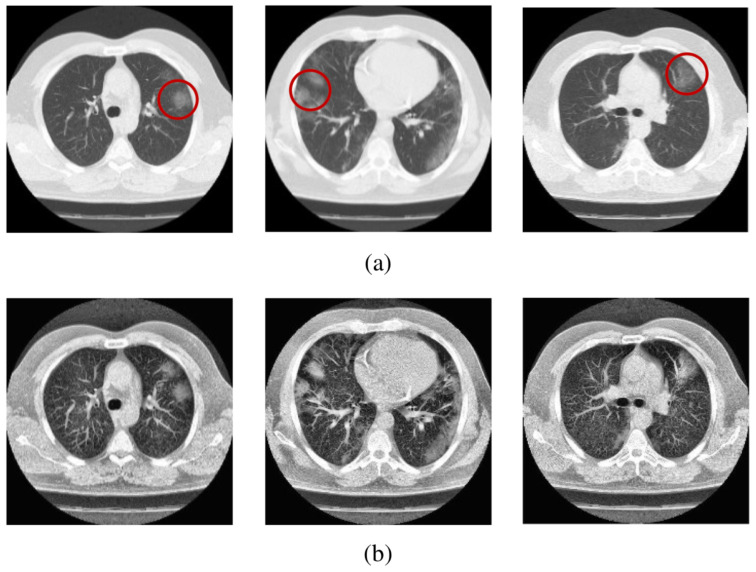
Figure 4.
Sample scans from the dataset before and after enhancement showing infected lungs. (a) Original computer tomography scans, with red circles highlighting some regions where fibrosis can be seen; (b) enhanced computer tomography scans using . Further details can be seen in [13].

