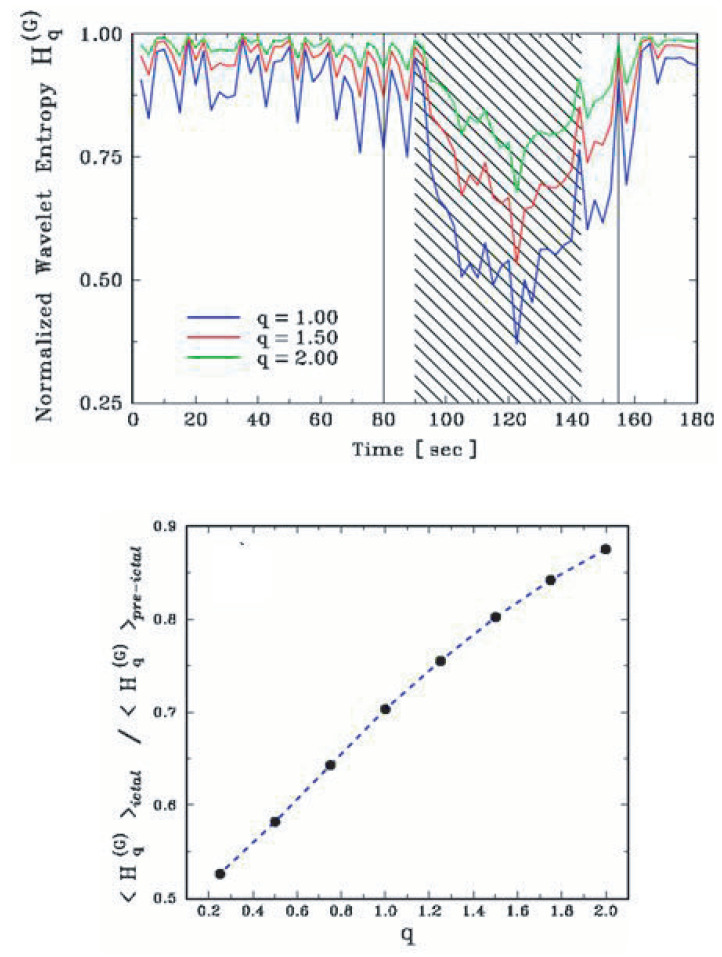
Figure 8.
(Top panel) After processing (of the EEG signal), which includes the use of the entropic functional , the precise location of the tonic–clonic transition becomes very visible. (Bottom panel) The effect is even more pronounced for values of q going below unity. Further details can be seen in [42].

