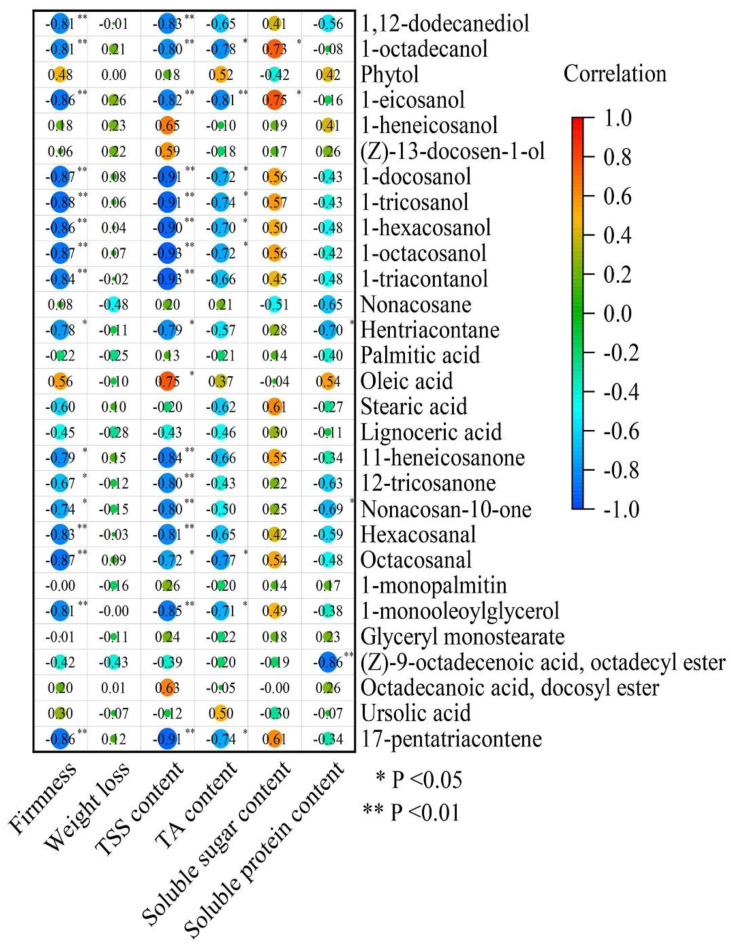
Figure 7.
Correlation analysis between wax common constituent and fruit quality among three plum cultivars during storage at room temperature. Note: the Pearson correlation coefficient is expressed by the size of the circle. Blue color indicates negative correlation, and red color indicates positive correlation. * represents significant difference (p < 0.05), and ** represents extremely significant difference (p < 0.01).

