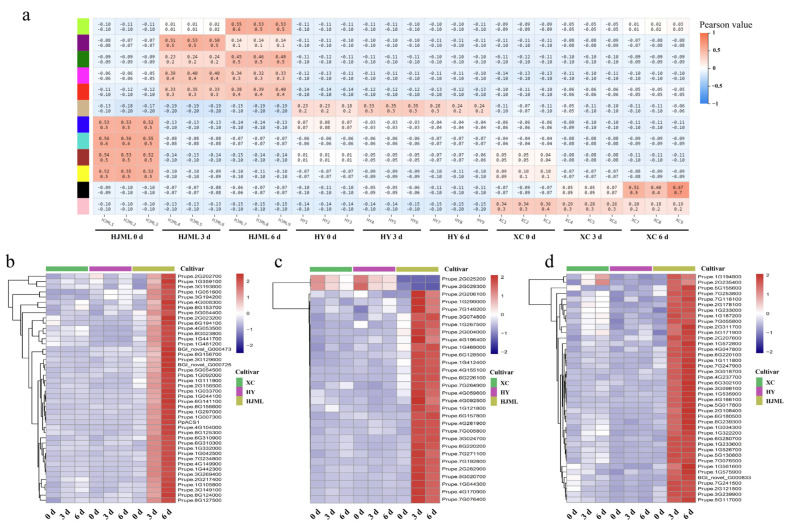
Figure 3.
Weighted gene co-expression network analysis. (a) Correlation analysis between co-expression gene modules and phenotype. (b–d) Heatmaps of co-expression network analysis of stage-specific modules by RNA-Seq data: b represents the green module, c represents the magenta module, and d represents the red module. ‘XC’ represents ‘Xia Cui’, ‘HY’ represents ‘Hua Yu’, and ‘HJML’ represents ‘Hujing Milu’.

