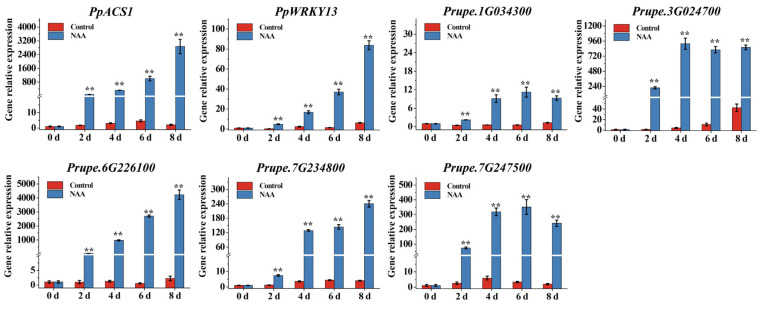
Figure 8.
The relative expression analysis by qRT-PCR of candidate genes in ‘XC’ fruit treated with NAA. The X-axis represents the number of days after harvest, whereas the Y-axis represents the relative gene expression levels. Data are means ± SEs (n = 3). ‘XC’ represents ‘Xia Cui’; significant differences (p < 0.01) by Student’s t-test between means are indicated by the symbol **.

