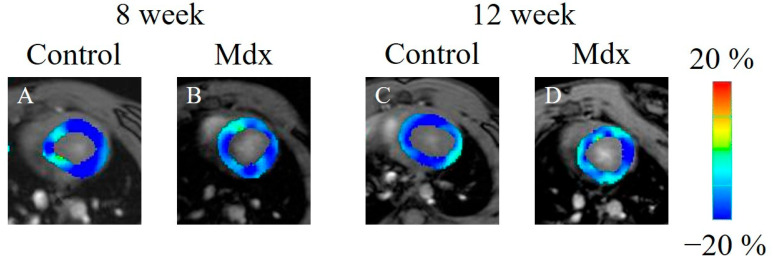
Figure 6.
Circumferential strain-encoded functional magnetic resonance imaging of the end-systolic left ventricle: (A) 8-week-old control mouse, (B) 8-week-old mdx mouse, (C) 12-week-old control mouse, (D) 12-week-old mdx mouse. The color bar shows the scale of the strain based on the end-diastolic left ventricle, with maximum contraction shown in blue and minimum contraction in red.

