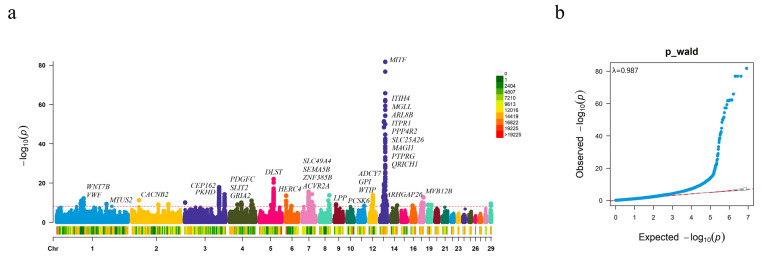
Figure 3.
Genome-wide association study results for white plumage. (a) Manhattan plot of GWAS results. The Y-axis shows −log10 (p-values). The two red dashed horizontal line indicates genome- wide significance thresholds (6.042978 × 10⁻⁹). (b) Q-Q plot. Lambda (λ) is the genomic expansion factor. A total of 24 ducks showed white plumage while 56 controls were spotty.

