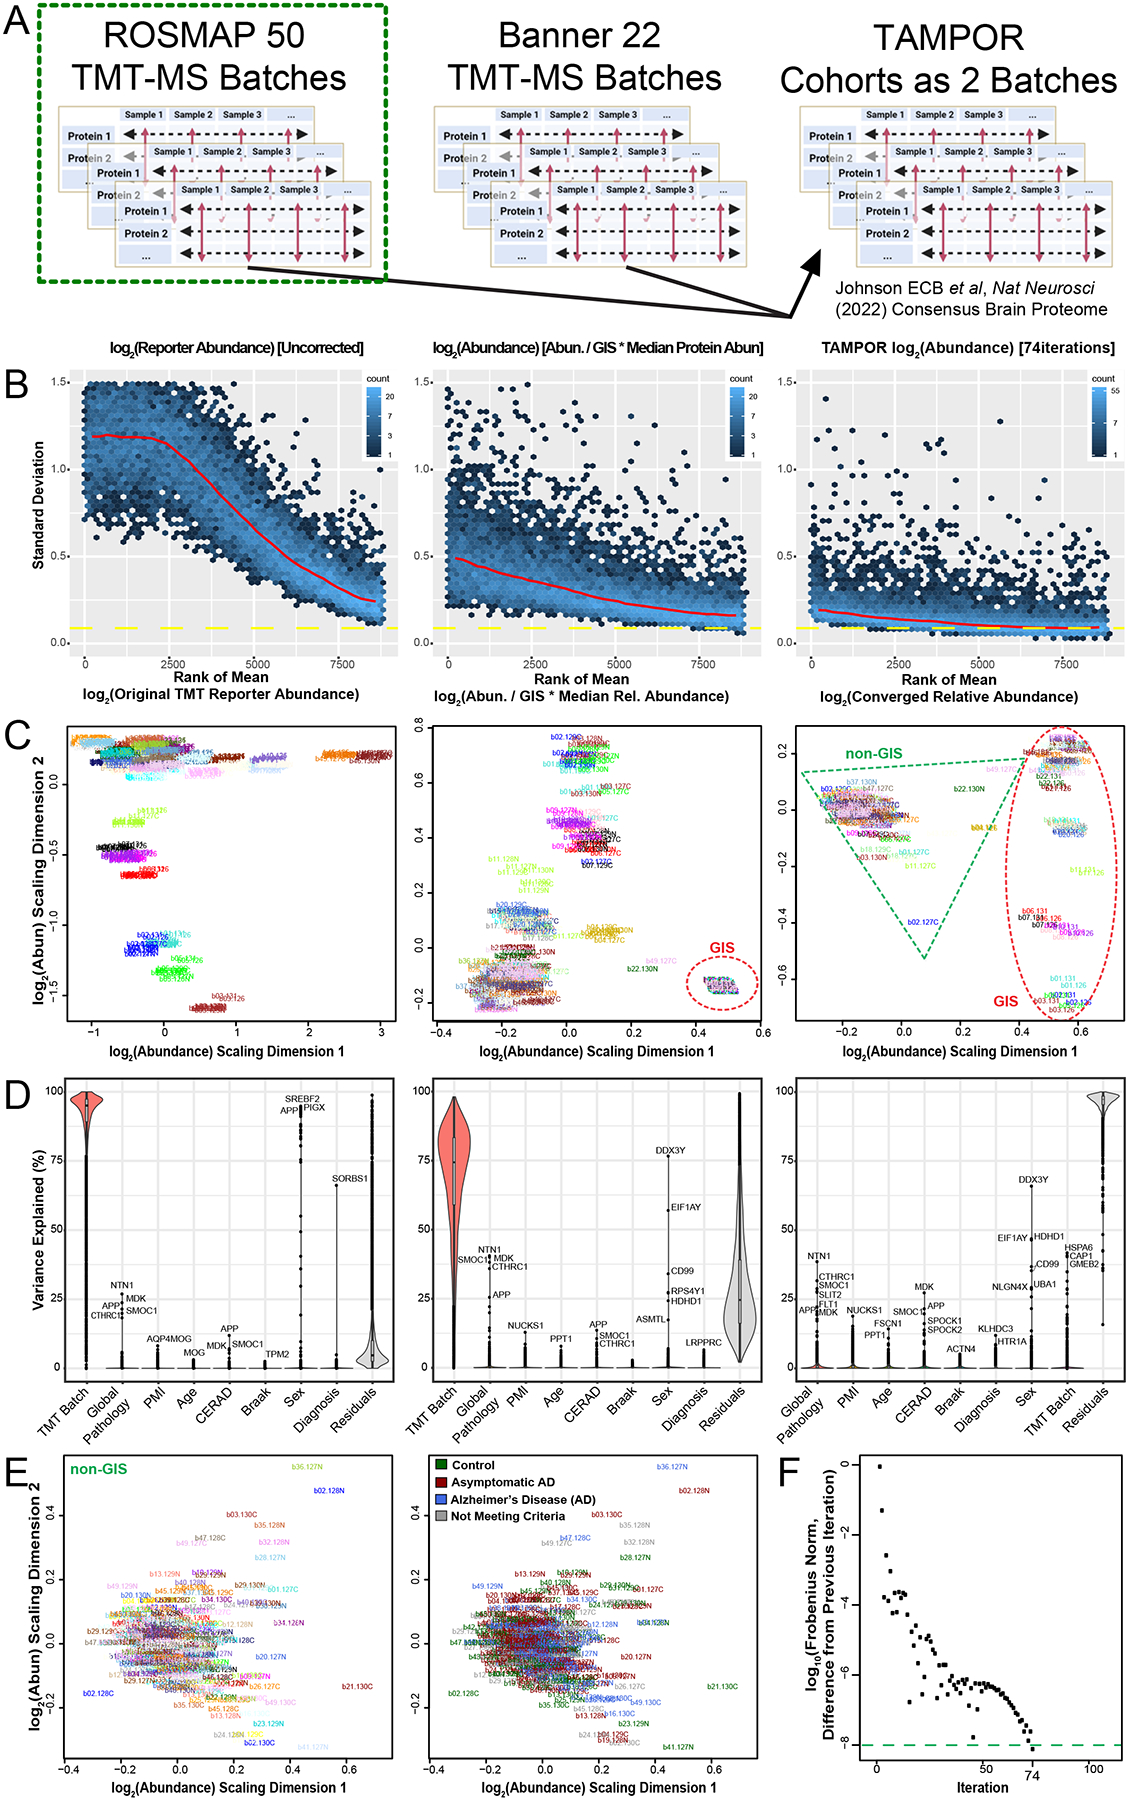
Figure 2. Use case 1: TAMPOR correction of TMT-MS data of 400 frontal cortex brain proteomes with a defect in GIS.

(A) TAMPOR was performed sequentially on two cohorts of TMT-MS data, first to remove intracohort batch effects, and then to harmonize across the two cohorts, ROSMAP (50 TMT-MS batches), and Banner-SunHealth (22 TMT-MS batches). (B) Mean-SD plots of variance in original ROSMAP50 TMT log2 abundance data for 400 case samples plus 100 GIS samples (left), naïve ratio-corrected log2 abundance (center), and TAMPOR log2 abundance (right), indicating progressive improvement in reduction of overall variance. (C) MDS plots of inter-sample variance with sample names as labels, colored by batch. Left, original ROSMAP50 TMT log2 abundance; center, naïve ratio-corrected log2 abundance; and right, TAMPOR log2 abundance. GIS sample cluster(s) are circled in the center and right panels with a red dashed ellipse. Non-GIS samples are within the green dashed triangle on the right. (D) Variance partitioning violin plots indicating median variance explained by each variable, with the top proteins for clinical, pathological, and demographic variables specified. Left, original ROSMAP50 TMT log2 abundance; center, naïve ratio-corrected log2 abundance; and right, TAMPOR log2 abundance. (E) Left, The non-GIS samples in the rightmost panel C are replotted in their own MDS of samples colored by batch. Right, sample labels are recolored by their case diagnoses at time of death. (F) Convergence plot from TAMPOR for the ROSMAP 50 batch TMT abundance data. TAMPOR abundance converged in 74 iterations.
