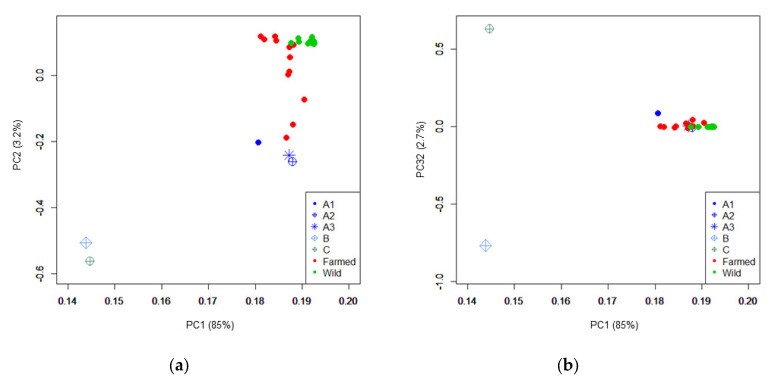
Figure 1.
PCA obtained plots of the gilthead seabream populations and nuclei investigated in this study. The first three Principal Components (PC) are reported with the explained variation in parentheses. The three subpopulations of offspring derived from the same nucleus (A1, A2, and A3) are all labelled in blue but indicated with different marks. (a) PC1 1 and PC2; (b) PC1 and PC3.

