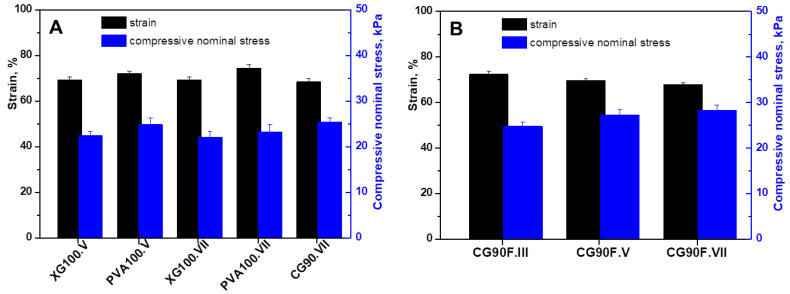
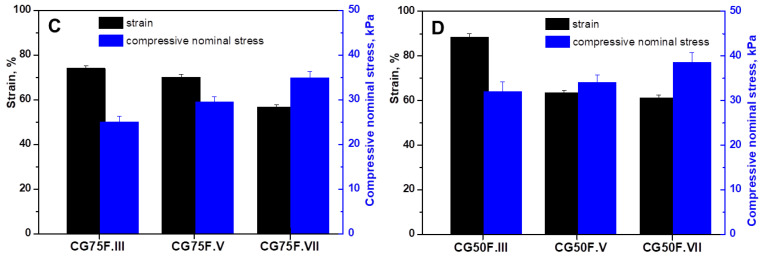
Figure 2.
Maximum sustained compression (black color) and compressive strength (blue color): (A) control samples; (B) composite hydrogels prepared with a weight ratio between XG and PVA of 9:1; (C) composite hydrogels prepared with a weight ratio between XG and PVA of 3:1; (D) composite hydrogels prepared with a weight ratio between XG and PVA of 1:1. All the data were expressed as the mean of three individual measurements ± SD. The SD is presented as error bars.


