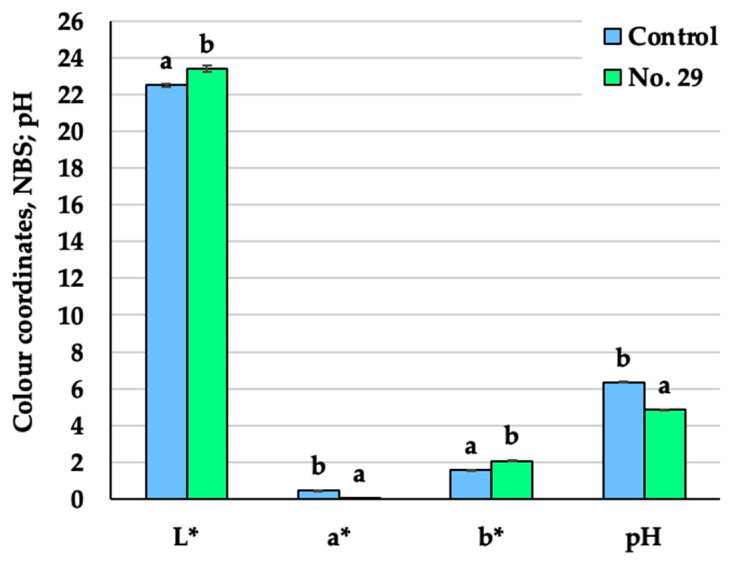
Figure 2.
Changes in the pH values and colour coordinates in the Spirulina samples (Control—Spirulina powder and water mixture, 1:2 w/w; No. 29—Spirulina samples fermented for 24 h with Pediococcus acidilactici, strain No. 29; L*—lightness; a*—redness or—a*—greenness; b*—yellowness or—b*—blueness; NBS—National Bureau of Standards units. Data are represented as means (n = 6) ± standard error. a–b mean values denoted with different letters indicate significantly different values between the samples (p ≤ 0.05)).

