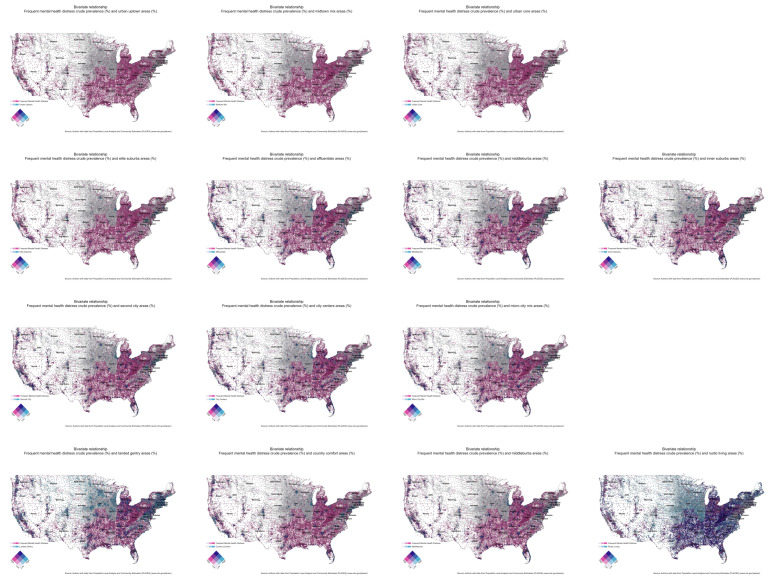
Figure 2.
Bivariate choropleth maps between the crude prevalence of frequent mental health distress and individual social groups. A pink shade indicates a high spatial concentration of frequent mental health distress, while a light blue indicates a high geographic presence of a particular social group. A dark blue shade suggests a high spatial concentration of both frequent mental health and a particular social group.

