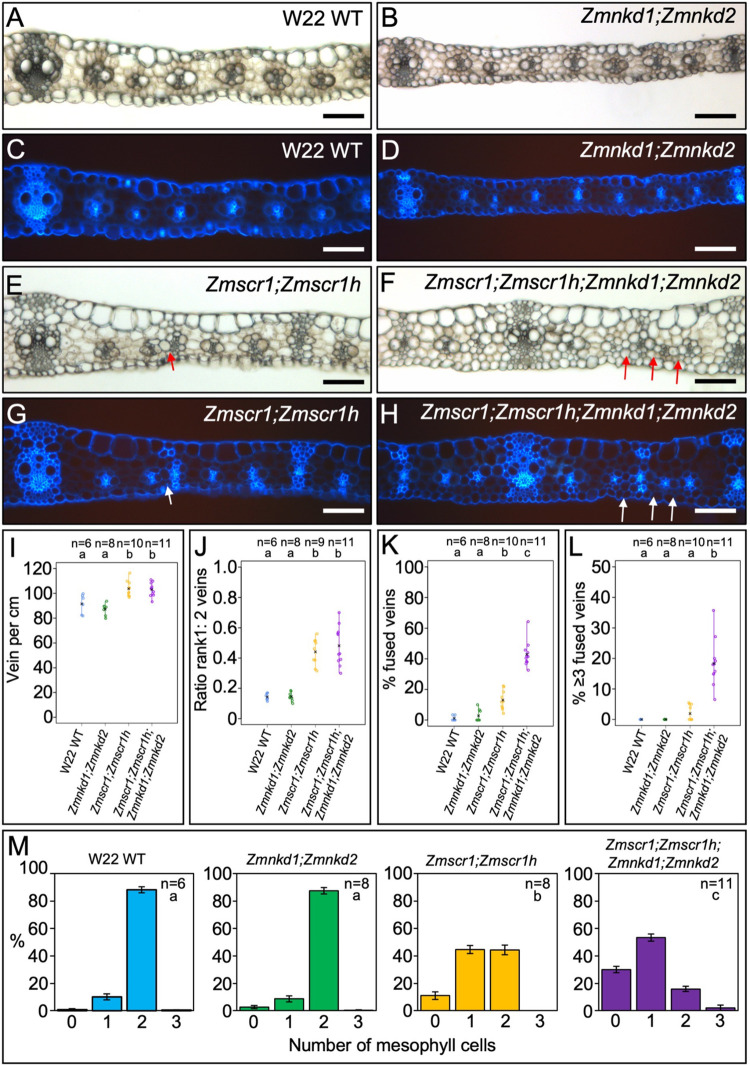
Fig 7. Zmscr1;Zmscr1h;Zmnkd1;Zmnkd2 quadruple mutants have a striking increase in the number of fused leaf veins compared to Zmscr1;Zmscr1h double mutants.
A-H) Transverse cross sections of wild-type (WT) W22 (A & C), Zmnkd1-Ds;Zmnkd2-Ds (B & D), Zmscr1-m2;Zmscr1h-m1 (E & G) and Zmscr1-m2;Zmscr1h-m1;Zmnkd1-Ds;Zmnkd2-Ds (F & H) leaf 3, from the mid-point along the proximal distal axis and imaged under either brightfield (A-B, E-F) or UV (C-D, G-H) illumination. Quadruple mutants were segregating in progeny of selfed Zmscr1-m2;Zmscr1h-m1/+;Zmnkd1-Ds;Zmnkd2-Ds parents, nkd double mutants were derived from selfed Zmnkd1-Ds;Zmnkd2-Ds parents and scr double mutants from selfed Zmscr1-m2/+;Zmscr1h-m1 parents. Arrows point to fused veins. Scale bars: 100 μm. I-L) Strip charts summarizing quantification of vein density (I), the ratio of rank 1: rank 2 intermediate veins (J), the % of fused veins (K) and the % of veins formed in runs of ≥3 fused veins (L). Open circles indicate measurements from independent biological replicates, and black crosses indicate the mean for each genotype. The number of biological replicates (n =) is indicated above each plot and letters at the top of each plot indicate statistically different groups (P≤0.05, one-way ANOVA and Tukey’s HSD) (raw data in S1 Table). M) Histograms summarizing the mean number of mesophyll cells separating veins in WT W22 (blue), Zmnkd1-Ds;Zmnkd2-Ds (green), Zmscr1-m2;Zmscr1h-m1 (yellow) and Zmscr1-m2;Zmscr1h-m1;Zmnkd1-Ds;Zmnkd2-Ds (purple) mutants. Error bars are standard error of the mean. Sample sizes (n =) are biological replicates and letters in the top right corner (beneath sample sizes) of each plot indicate statistically different groups (P≤0.05, one-way ANOVA and Tukey’s HSD) calculated using the mean number of mesophyll cells in each genotype (raw data in S1 Table).

