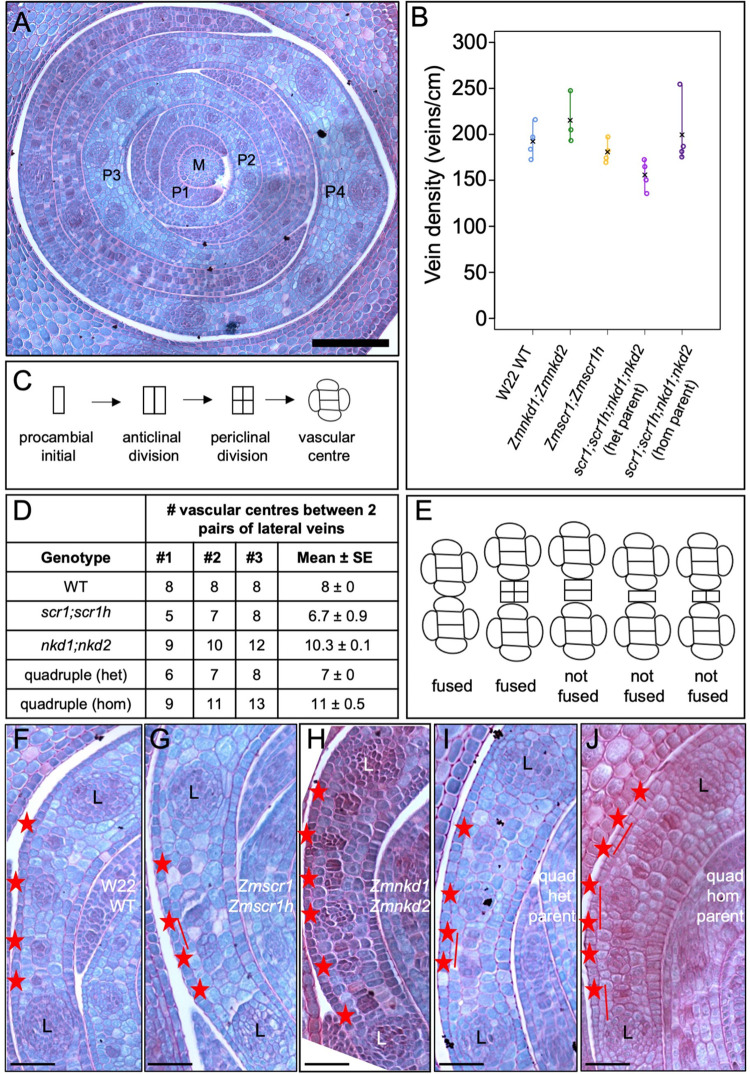
Fig 8. Embryonic leaf phenotypes reveal patterning defects during embryogenesis.
A) Transverse section of a wild-type (WT) W22 embryo taken across the tip of the meristem (M), such that P1-P4 leaf primordia are visible. Scale bar: 100 μm. B) Quantification of vein density in P4 primordia. Open circles indicate measurements from independent biological replicates, and black crosses indicate the mean for each genotype (raw data in S1 Table). C) Schematic of rudimentary cell division patterns seen in the innermost ground meristem layer of the leaf as procambium is initiated to form intermediate veins. D) Number of vascular centres observed between two pairs of lateral veins (one each side of the midvein) in P4 primordia of three mature embryos for each genotype. Data sourced from images in S10 Fig. E) Schematic showing criteria used for scoring fused vein phenotype. Vascular centres were not scored as such unless both an anticlinal and periclinal division had occurred. F-J) Representative transverse sections of P4 primordia from WT W22 (F), Zmscr1-m2;Zmscr1h-m1 (G), Zmnkd1-Ds;Zmnkd2-Ds (H), Zmscr1-m2;Zmscr1h-m1;Zmnkd1-Ds;Zmnkd2-Ds from a heterozygous NKD/nkd parent (I) and Zmscr1-m2;Zmscr1h-m1;Zmnkd1-Ds;Zmnkd2-Ds from a homozygous nkd parent (J), showing developing intermediate veins (red asterisks) between a pair of lateral (L) veins. Full images are shown in S10 Fig Scale bars: 40 μm.

