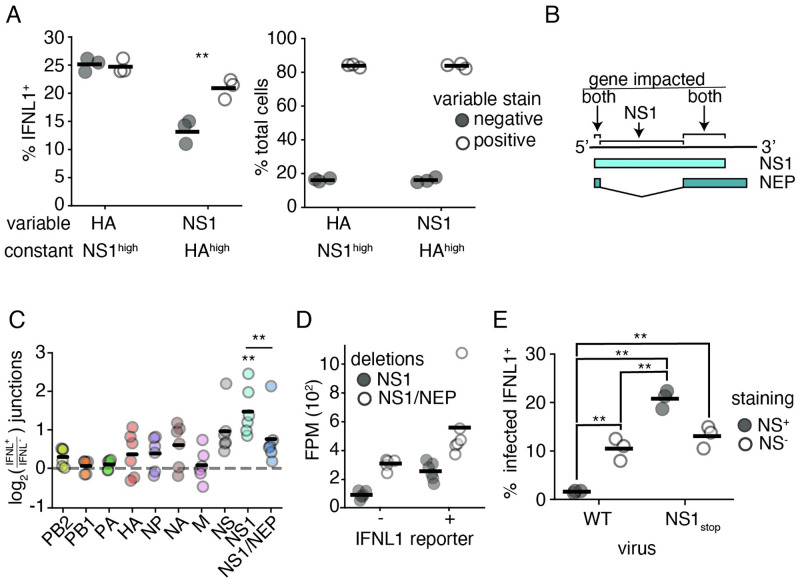
Fig 6. Overlap of NS1 and NEP partially limits interferon production.
(A) A549 IFNL1 reporter cells were infected with NS1stop virus at an MOI of 0.1, stained for HA and NS1 and analyzed by flow cytometry 13hpi. Infected cells were defined by meeting the staining threshold for the indicated constant stain, the median staining observed in IFNL1+, infected, cells. (left) Frequencies of IFNL1+ reporter expression were compared between populations staining positive, or negative, for the variable stain. Singificant differences in the fraction of IFNL1+ cells between those positive, and negative, for a stain marked by an asterisk, two-tailed t test with Benjamini-Hochberg multiple hypothesis correction at an FDR of 0.05, n = 3. Individual replicates shown, n = 3. (right) Fraction of cells positive, or negative, for the indicated variable stain in each group. There is no significant difference between staining efficiency for HA and NS1 under these conditions, two-tailed t test p<0.05, n = 3. Full data with replicates shown in S18 Fig (B) Diagram of how deletions were called in terms of impact. Deletions removing overlapping regions were called as impacting NS1 and NEP, those restricted to just the NS1 reading frame as just NS1. (C) A549 IFNL1-reporter cells expressing each of the individual polymerase genes (PB1, PB2, or PA) were infected at a genome-corrected MOI of 0.1 with high-defective influenza and magnetically sorted at 13hpi depending on reporter gene expression. Influenza genomic material was specifically reverse-transcribed, amplified, fragmented, and sequenced. Junction-spanning counts were normalized to total fragments mapping to a segment, and compared between matched IFNL1-enriched and -depleted samples. Only deletions covering NS1 alone were significantly enriched, one-sample two-tailed t test with Benjamini-Hochberg multiple testing correction at an FDR of 0.05. Deletions covering NS1 alone were more significantly enriched with interferon expression compared to those covering NS1 and NEP, two-tailed t test, p<0.05. Individual points are independent experiments, n = 6. (D) Normalized data from D on just NS1 and NS1/NEP. Results were not driven due to better sampling of deletions in NS1 alone, as evidenced by higher deletion abundance in the NS1/NEP category. (E) The experiment in A was performed alongside a wild type comparison, at the same MOI (0.1) at the same timepoint (13hpi), stained using the same antibodies (HA and NS1), and gated on the median HA value observed in IFNL1+ HA+ NS1stop infections. Presence and absence of staining for the NS1 antibody noted. Asterisks indicate significant difference, ANOVA p<0.05, post hoc Tukey’s test, q<0.05, n = 3. Full data with replicates shown in S18 Fig.

