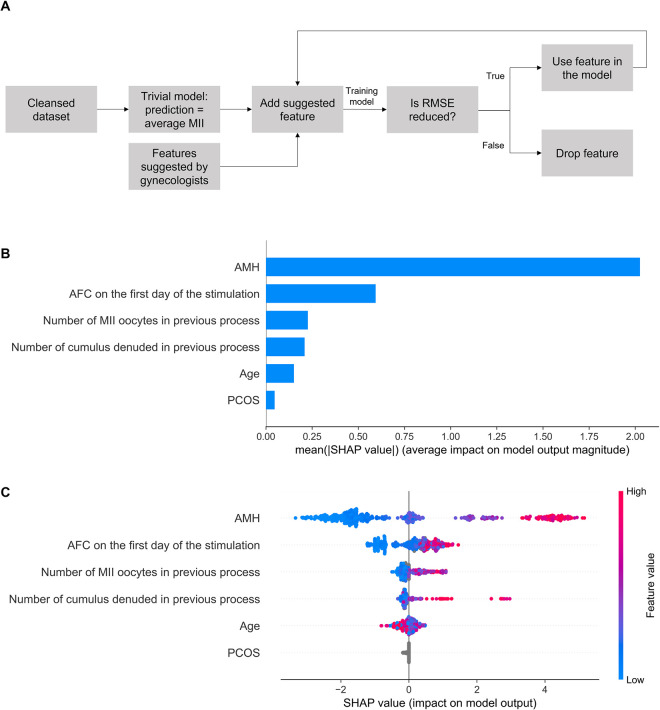
Fig 1. Clinical model for prediction of the number of MII oocytes.
(A) Feature selection of clinical features. (B) The importance ranking of the top six features according to the mean absolute SHapley Additive exPlanations (SHAP) value (|SHAP value|). (C) The effect of features on the outcome of the model. The higher the SHAP value of a feature, the higher the number of MII oocytes. A feature takes values from low (blue) to high (red). The feature ranking (y-axis) indicates their importance in the predictive model. The SHAP value (x-axis) is a unified index that responds to the influence of a certain feature in the model. For each feature, the attributions of all patients to the outcome are drawn with dots, where red represents the high-risk value and blue represents the low-risk value. AFC—antral follicle count; AMH—anti-Müllerian hormone; PCOS—polycystic ovary syndrome; RMSE—root mean squared error.

